
Climate Overview
The latest headline numbers for climate change, and a guide to every climate page on the site…
The latest headline numbers for climate change, and a guide to finding your way around this part of the site. Search or browse below for the latest monthly update for any place - from a global summary to every continent, country, US climate region, US state and UK region.
Current Readings
The Climate Now
Key Questions
Find the Right Page
Is it getting warmer where I live?
Every continent, country, US climate region, US state and UK region has its own page - the latest month against established baselines, the long-term trend, its records and the events in its history.
How unusual is this month?
The whole planet this month, where each place ranks, and how far it moved from established baselines.
What's driving this season's weather?
Ocean and atmosphere patterns - El Niño and the Indian Ocean Dipole, the NAO and the polar vortex - shift the odds of a hot, wet or cold season. The Symphony shows them all together and how they connect.
What's causing the warming?
Greenhouse gases from burning fossil fuels, partly masked for decades by air pollution. Follow the gases, the emissions and the eras they created.
What does it mean for people and nature?
Longer heatwaves, more extreme weather, shrinking ice, rising seas and seasons arriving at different times.
Are we near a tipping point?
Warm-water coral reefs are judged to be passing theirs now, and the Atlantic's ocean conveyor and the great ice sheets are watched closely. See all 16 known tipping points against today's warming, follow the live data, and the nine planetary boundaries.
I want the basics first
Plain-English explanations of the ideas used throughout the site, and exactly where every number comes from.
Where can I learn more?
Classroom guides and citation help, recommended books, and the latest articles on the blog.
Explore the Tools
Interactive Climate Tools
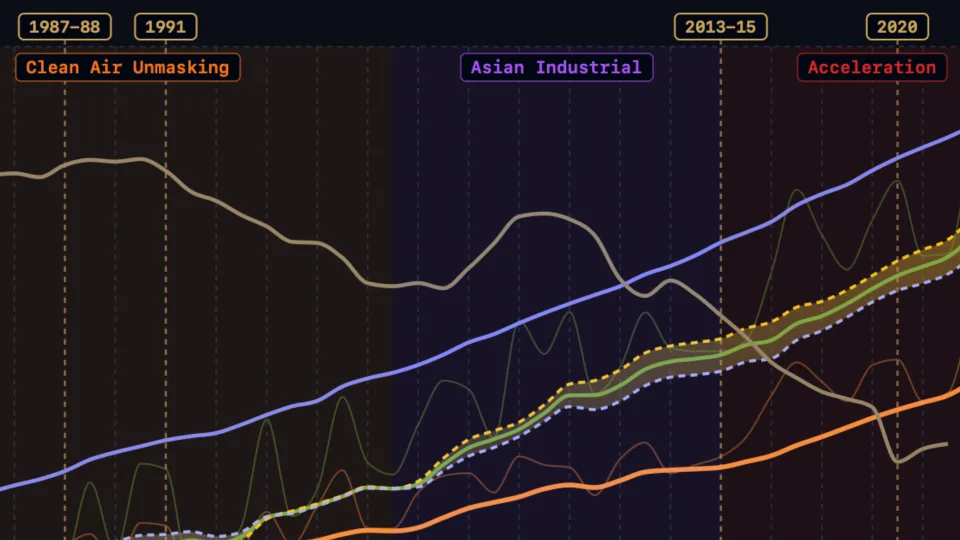
Temperature since 1950 for every country and region, set against rainfall, frost, snow, CO₂ and SO₂ - with climate eras and sourced events
Climate Insights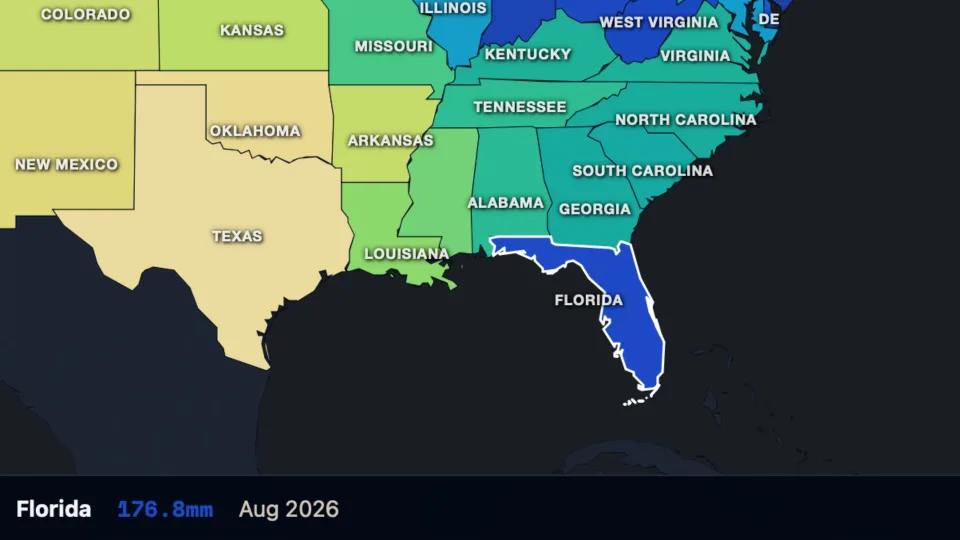
Every continent, country and region on one map - temperature, warming trends, rainfall, frost, snow and heatwaves
Climate Map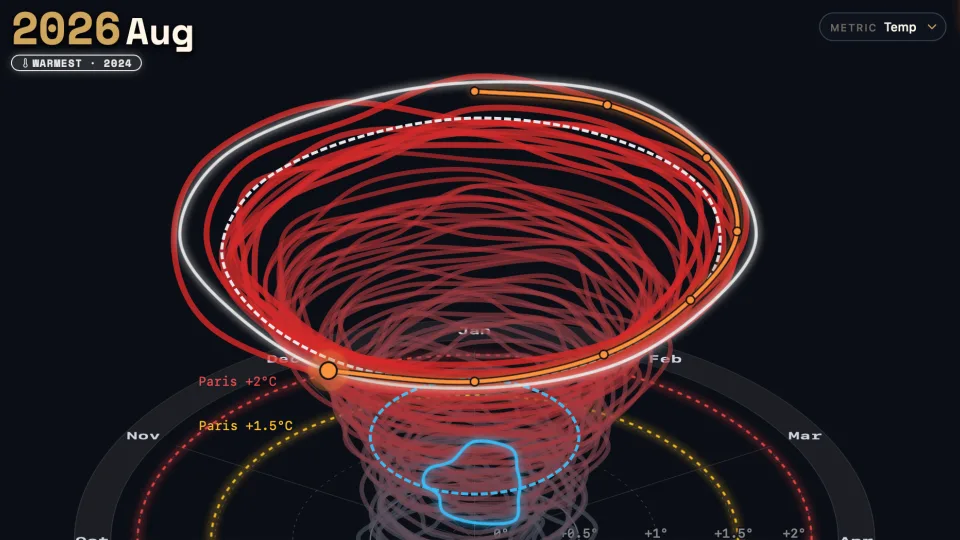
One loop per year - temperature, rainfall, sunshine and frost since records began, for every country and region
4byo Climate Helix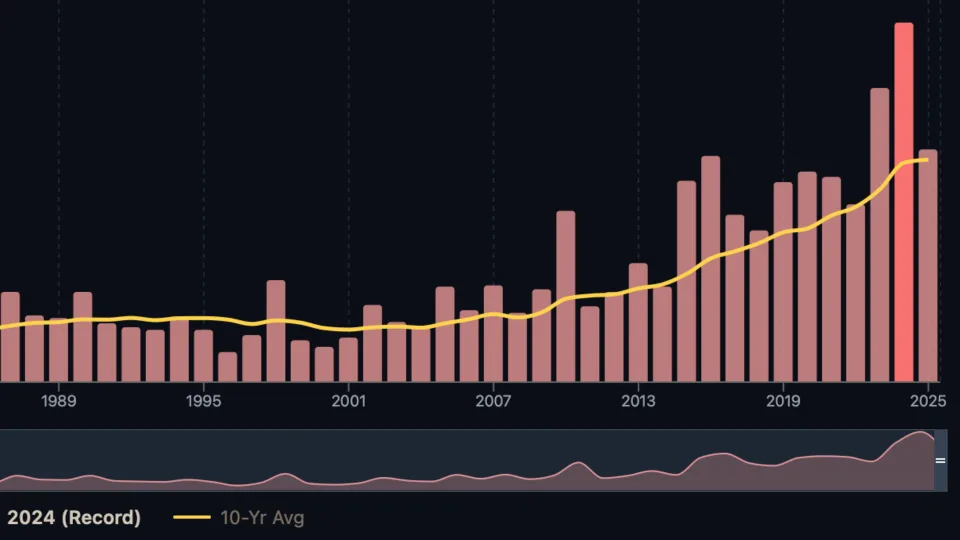
Heatwave days each year since 1950 for the world, every country, US state and UK region - with an El Niño / La Niña overlay
Heatwave Days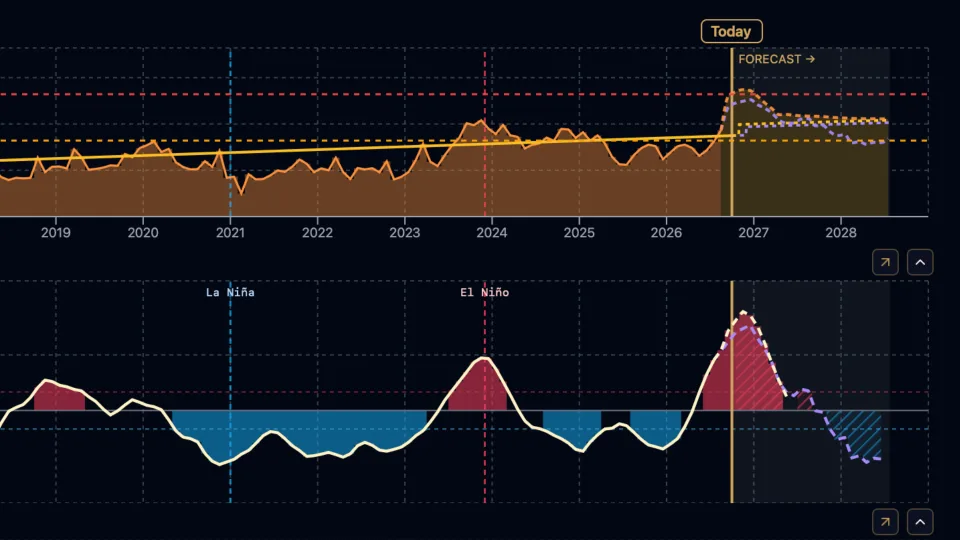
ENSO, the NAO, the polar vortex and other climate drivers on one live timeline - with a 9-season forecast
4byo Climate Symphony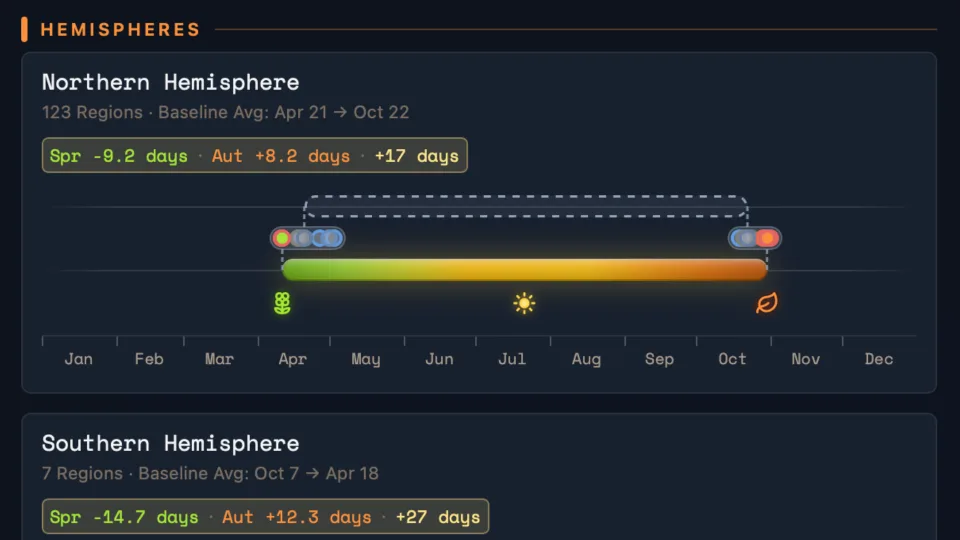
Earlier springs, later autumns and shifting wet seasons worldwide - from 1,200 years of cherry blossom to today
Shifting SeasonsComing Soon
In Development
4byo Matrix
In ProgressHow it all connects - warming, El Niño and La Niña, rainfall, heatwaves and the other climate drivers side by side, to show what drives what.
4byo Climate Horizon
In ProgressThe bigger picture - where humanity fits into Earth's long climate record, and what the future might look like.
The Basics
Four Ideas Used Throughout the Site
- Anomaly
- How far a measurement sits above or below the baseline for the same place and time of year. Measuring every place against its own baseline is what lets a hot country and a cold one be ranked side by side on how unusual their month was.
- Baseline
- The fixed reference period an anomaly is measured against. The site defaults to 1961-1990, the WMO's long-standing reference for climate change, and many charts can switch to NOAA's 1901-2000 mean or the WMO's current 1991-2020 normal - the established baselines used in climate science, so figures here compare directly with those published by the agencies. A later baseline is already warmer, so it gives smaller anomalies.
- The 1.5°C Paris limit
- The Paris Agreement's aim of keeping global warming to 1.5°C above the pre-industrial level (1850-1900). It is judged on long-term warming, so this site tracks the 10-year average - a single year above 1.5°C does not mean the limit has been passed.
- El Niño and La Niña
- The Pacific's natural swing between a warm phase (El Niño) and a cool one (La Niña) every few years, shifting weather patterns around the world. Global temperature spikes during an El Niño, and the floor it settles back to afterwards has stepped higher after each major event - the warming trend showing through.
Every Climate Page
The Whole Climate Section
Monitor
- Global Update
Whole-planet temperature & trend update
- Country & Region Updates
6 continents · 169 countries · 50 US states · 9 US climate regions · 14 UK regions
- Rankings
League table of 232 regions + monthly trends
- Climate Records
Warmest/coldest year, current-year rank & Top 10 by region
Explore
- Climate Insights
Temperature since 1950 for every country and region, set against rainfall, frost, snow, CO₂ and SO₂ - with climate eras and sourced events
- Climate Map
Every continent, country and region on one map - temperature, warming trends, rainfall, frost, snow and heatwaves
- 4byo Climate Helix
One loop per year - temperature, rainfall, sunshine and frost since records began, for every country and region
- Heatwave Days
Heatwave days each year since 1950 for the world, every country, US state and UK region - with an El Niño / La Niña overlay
- 4byo Climate Symphony
ENSO, the NAO, the polar vortex and other climate drivers on one live timeline - with a 9-season forecast
- Shifting Seasons
Earlier springs, later autumns and shifting wet seasons worldwide - from 1,200 years of cherry blossom to today
Climate Drivers
- ENSO - El Niño / La Niña
ENSO tracker: Niño 3.4, MEI, SOI & forecast
- NAO Tracker
North Atlantic Oscillation – Europe & North Atlantic weather patterns
- Polar Vortex / AO
Stratospheric polar vortex & Arctic Oscillation tracker
- Indian Ocean Dipole
Indian Ocean's own ENSO – East Africa vs. Indonesia/Australia flood-drought seesaw
- AMOC - Ocean Conveyor
The Atlantic overturning measured directly - is it slowing, and how close is a tipping point?
Planetary Health
- Planetary Boundaries
All nine Earth-system limits - seven now crossed - each against its safe level
- Climate Tipping Points
All 16 tipping points against today's warming, with cascades and positive tipping points
- Greenhouse Gases
CO₂, methane & N₂O levels
- Sea & Ice
Sea level rise & Arctic ice extent
- Coral Bleaching Tracker
Daily heat stress for 214 reef regions, the four-month bleaching outlook and the El Niño link
- Extreme Weather
Live disaster alerts and every major weather disaster since 1900, by country
- CO₂ Emissions
Country rankings & trends
Learn
- Explained
Plain-English guide
- Methodology & Sources
Baselines, data sources & timeline
- For Students & Teachers
Curriculum guide & citation help
- Books
Recommended reading on climate
- Blog
Latest articles
Latest Articles
From the Blog
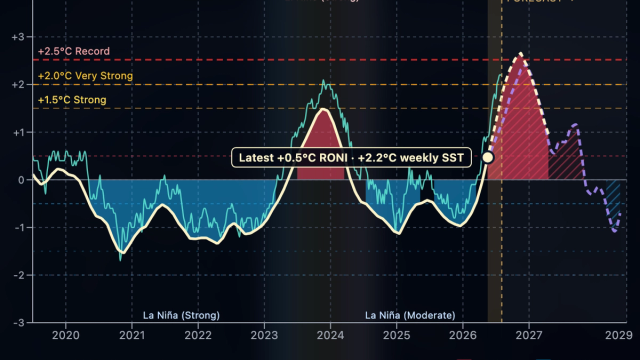
2 Aug 2026
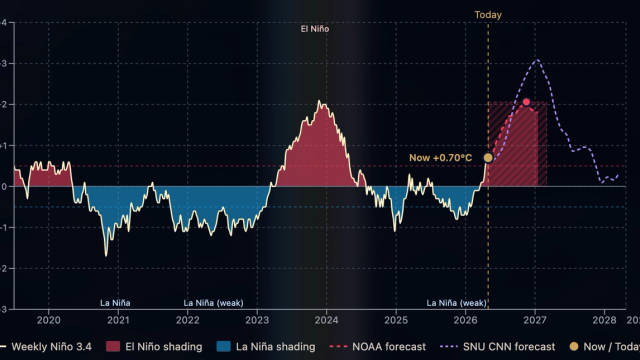
The 2026 El Niño, Stripped to the Science: The Signal, the Warming, and the Following La Niña
A very strong El Niño is coming, and for once the physics models and a deep-learning AI agree on it. But strip out the global warming it's developing in, and the event sits alongside 1982-83 rather than beyond it. The real risk lies in the warmer world it's entering ... and in the La Niña that tends to follow.
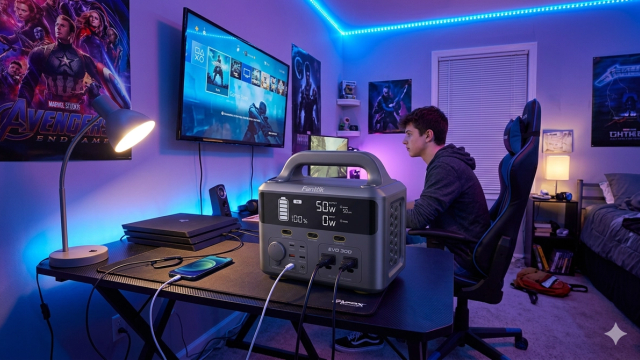
1 May 2026
"What do you want for your birthday?" ... A battery bank for my bedroom, to help save the planet
Millions of teenagers are genuinely worried about climate change. Some are doing the big things - protesting, going vegan, badgering their parents to switch energy supplier. But one quietly practical idea is gaining traction: a plug-in portable battery bank, charged overnight on cheap electricity, used to power your bedroom setup during the evening peak. Does it actually reduce carbon emissions? And does it save any money? We ran the numbers for both the UK and the USA.
28 Apr 2026
El Niño is Coming. This time, the baseline is higher.
When the next strong El Niño arrives, it will build on top of an unprecedented baseline. The last one made 2024 the first calendar year to average above 1.5 °C globally. Each successive event sets its record not because the ENSO pulse itself is larger, but because the floor keeps rising.