El Niño is Coming. This time, the baseline is higher.

The Pacific is neutral right now. The official index sits at -0.16 °C for January to March 2026, comfortably inside the neutral band. But look at the coastal Pacific, and the picture shifts. The Niño 1+2 region, the narrow strip of ocean just off the coast of Peru where El Niño signals first emerge, is already running at +1.80 °C above the 1991–2020 baseline. The warm water is there. The question is whether the atmosphere will couple with it. Models from 26 dynamical and statistical centres suggest it will.
What the Forecast Actually Says
NOAA's official probability outlook puts El Niño onset at 61% for May–Jul 2026, the standard threshold season for calling a new event. From there the probability climbs steeply: 79% in June–July–August, 87% in July–August–September, and then above 90% for three consecutive seasons through to January 2027.[1] The peak sits at 93% in October–November–December.
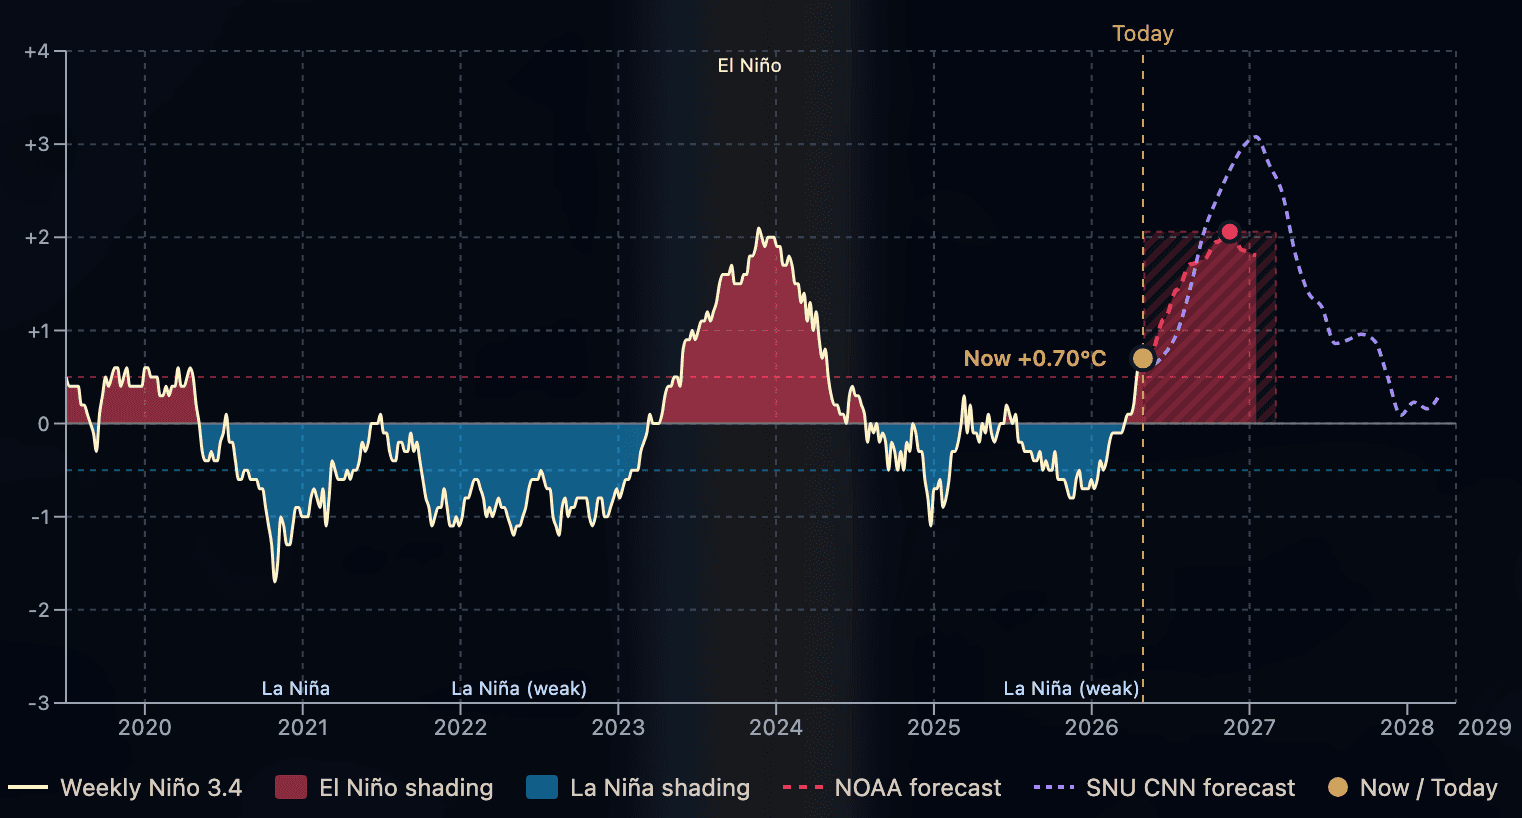
The IRI/CCSR multi-model plume, which pools the output of all 26 models, puts the average peak intensity at +2.1 °C in the Niño 3.4 region during that October–December window.[2] That's the dynamical model mean - some individual models run hotter. An anomaly of +2.1 °C sits comfortably in strong-to-super El Niño territory, comparable in intensity to the 2023–24 event that peaked at +2.0 °C.
Forecast at a glance
El Niño probability crosses 50% in May–Jul 2026 (61%), climbs above 90% by August–September–October, and peaks at 93% in October–November–December. The multi-model mean projects a peak intensity of +2.1 °C in Niño 3.4. This is strong-to-super territory. Source: NOAA CPC / IRI–CCSR plume, issued March 2026.
| Source | Peak Intensity | Peak Timing | Forecast Horizon |
|---|---|---|---|
| NOAA / IRI–CCSR plume (26 models) | +2.1 °C | OND 2026 | ~9 months |
| SNU ACE Lab CNN [8] | Higher / longer tail | Early–mid 2027 | Mar 2028 |
A Second Model Sees a Longer Event
The IRI/CCSR plume is the forecasting standard, but it has a structural limitation: the physics-based models that compose it typically lose meaningful skill beyond nine months. A second forecast, from the Seoul National University ACE Lab, is now worth watching alongside it, precisely because it is designed to operate where the plume goes quiet.
The SNU model is a Convolutional Neural Network trained directly on observational data (Ham et al., 2019, Nature).[8] Rather than solving the equations of ocean physics, it learns the statistical patterns in sea surface temperature, thermocline depth, and atmospheric circulation that precede ENSO events, and has demonstrated skill at lead times of 18–24 months where traditional models struggle. Its April 2026 forecast extends all the way to March 2028.
The difference in what it shows is significant. Where the NOAA plume forecasts a peak in OND 2026 followed by a fairly rapid decline toward neutral, the SNU CNN curve stays elevated well into 2027 before declining. If that persistence forecast proves correct, this would not be a sharp single-season spike, but a prolonged warm phase, adding its anomaly on top of an already elevated baseline for a much longer stretch than 2023–24 did. The cumulative heat addition, and the cumulative impact on coral systems, fire risk and regional drought, would be substantially greater than the NOAA peak intensity figure alone implies.
Why the models diverge at long range
Physics-based ensemble models solve equations of ocean and atmospheric circulation, but small initial errors compound quickly. Beyond ~9 months, the spread between ensemble members typically swamps the signal. The SNU CNN takes a different approach: it identifies recurring large-scale patterns in historical SST data that precede ENSO shifts, without needing to simulate the intervening dynamics step-by-step. This gives it different error characteristics, potentially better calibrated at long lead times, but also less interpretable. Both forecasts should be tracked, not treated as competing alternatives.
Why the Indicators Aren't All Agreeing Yet
ENSO has three widely watched indicators, which are currently telling slightly different stories. Niño 3.4 SST has risen to +0.70 °C as of late April 2026, the ocean signal has now crossed the +0.5 °C threshold that officially marks El Niño conditions.[3] The atmospheric side has not yet caught up: the Multivariate ENSO Index (MEI v2), which folds in sea-level pressure, surface winds, and outgoing longwave radiation alongside ocean temperatures, remains La Niña-leaning on its scale. The Southern Oscillation Index, the atmospheric side of the equation, also still leans La Niña in raw form.
This kind of divergence between the ocean and atmospheric signals is normal during a transition. El Niño needs both ocean warming and atmospheric coupling to lock in. The trade winds have to weaken, and the warm water has to spread west-to-east across the central Pacific. The coastal warmth seen in Niño 1+2 is a leading signal, not confirmation. When all three indicators climb together past their respective thresholds, the event has arrived. Watch for the MEI and SOI to follow the ocean signal over the coming months.
What Strong El Niño Events Actually Do
The regional fingerprints of El Niño are well documented, and some of them are remarkably consistent across events. Maritime Southeast Asia (Indonesia, Malaysia, the Philippines) experiences drought and elevated fire risk in roughly 80% of El Niño years. This is one of the most reliable teleconnections globally. Eastern Australia dries and warms in about 75% of events. The Amazon basin tends toward lower river levels and larger fire seasons, a pattern the 2023–24 event amplified to a record-breaking degree at Manaus.
Not all signals are dry. The coastal zone of Peru and Ecuador typically sees severe flooding, with fishery collapse as coastal upwelling weakens. East Africa's short rains improve. Parts of East Asia see a milder, wetter winter. The rainfall teleconnections are noisier than temperature ones. Probabilities in the 50–65% range rather than the high 70s and 80s, but across a large enough event, these patterns are visible.
| Region | Typical Signal | Probability |
|---|---|---|
| Maritime SE Asia | Warmer, drier (JJA–DJF) | ~80% |
| Eastern Australia | Warmer, drier (JJA–DJF) | ~75% |
| India (subcontinent) | Weaker SW monsoon (JJAS) | ~60% |
| Amazon basin | Warmer, drier (JJA–OND) | ~60% |
| Peru & Ecuador (coast) | Warmer, wetter (JFM) | ~80% |
| E. Africa (short rains) | Wetter (OND) | ~65% |
Typical El Niño regional responses. Probabilities reflect how often the signal occurs when El Niño is active. Source: Met Office GPC outlooks (Davey et al., 2013).[4]
The Baseline Has Shifted
The 2026 forecast is harder to read through the lens of historical events. Every El Niño in the record played out on a cooler baseline than the one we're sitting on now. The world is currently running at roughly +1.3 °C above the pre-industrial average as a long-term trend, before any ENSO signal is added on top. That background heat doesn't disappear during neutral or La Niña years, it simply gets temporarily masked by cooler Pacific conditions.
When a strong El Niño arrives, it adds its anomaly on top of that elevated baseline. The 1997–98 event (peak ONI +2.4 °C) briefly set a new global temperature record in 1998. The 2015–16 event did the same. Then 2023–24, with a peak ONI of +2.0 °C, made 2023 and then 2024 the two hottest years in the instrumental record by clear margins. 2024 became the first calendar year to average above 1.5 °C globally.[5] Each successive event sets its record not because the ENSO pulse itself is larger, but because the floor keeps rising.
"Every El Niño now releases its heat onto a baseline already ~1.3 °C above pre-industrial. The same ENSO events would have produced much smaller temperature spikes in an unwarmed world."
There's a second concern beyond temperature records. CMIP6 models project that ENSO-driven rainfall variability will increase with further warming. They suggest bigger droughts and bigger floods in the same teleconnection regions, because a warmer atmosphere holds roughly 7% more moisture per degree Celsius.[6] The IPCC found with high confidence that ENSO SST variability over the past 50 years has been larger than at any point in the previous 400. Coral and tree-ring records confirm it.
La Niña used to provide a temporary cooling counterweight. It still does, slightly. But the 2020–23 triple-dip La Niña, one of the longest on record, only managed to slow the warming trend, not reverse it. The system's ability to cancel out long-term warming is weakening as the baseline rises.
The Events That Shaped Our Understanding
The modern era of ENSO science was partly built on catastrophe. The 1982–83 event arrived almost without forecast. At the time, El Niño was still thought of as a local Peruvian phenomenon rather than a planet-wide climate driver. It caused what was then the largest ENSO-related humanitarian crisis on record: severe drought across Australia, catastrophic floods in Peru and Ecuador, and an estimated US$13 billion in damages (1983 USD).[7] Monitoring systems didn't exist to see it coming. Much of the TAO/TRITON buoy array was deployed in its wake.
The 1997–98 event was the most extreme of the 20th century, peaking at ONI +2.4 °C. It was better forecast, but still caused widespread disruption: Indonesian peatland fires that emitted roughly 1 Gt of CO₂, East African floods that displaced millions, and coral bleaching across the Indo-Pacific. The 2015–16 event, peak ONI +2.6 °C, became the largest on instrumental record, briefly nudging global temperatures to new highs and triggering the fourth global mass coral bleaching event.
2023–24 didn't break ONI records. It peaked at +2.0 °C, strong but not unprecedented. What made it historic was its timing, arriving on top of that elevated baseline. The coral bleaching it triggered in 2024 was declared the fourth and most extensive global bleaching event ever recorded.
What to Watch Over the Coming Months
The key signal to track is whether the atmospheric indicators catch up with the ocean. The Niño 3.4 SST has now crossed the El Niño threshold, but the MEI and SOI are still in La Niña-leaning territory. Ocean-atmosphere coupling is the mechanism that locks in an event, and it typically lags the initial SST warming by weeks to months. Westerly wind bursts in the equatorial Pacific, which are detectable from surface analysis, are an early sign of the atmosphere beginning to respond.
Model agreement will also sharpen as the spring predictability barrier passes. ENSO forecasts issued before May are inherently less reliable than those issued in June and beyond, because the signal-to-noise ratio in Pacific SSTs drops during boreal spring. The 93% probability figure for OND is robust precisely because it's far enough beyond that barrier. The MJJ figure of 61% carries more uncertainty. Meaningful divergence between dynamical and statistical models, or a sudden shift in trade wind strength, could still alter the picture before onset.
A second thing to watch is the growing divergence between the NOAA/IRI plume and the SNU ACE Lab CNN forecast. If the SNU model's persistence signal holds, showing the event remaining elevated well into 2027, that would be a materially different outcome than a single-season peak followed by rapid neutral return. As new monthly issues of both forecasts are released, the degree to which they converge or stay apart will be an important signal in itself.
Track the current state
Our ENSO Tracker combines all four indicators (Niño 3.4, ONI, MEI v2, SOI) with the official NOAA forecast and regional impact cards for over 20 regions worldwide. Updated monthly.
References
- NOAA Climate Prediction Center (2026). ENSO Diagnostic Discussion and Probability Outlook. National Oceanic and Atmospheric Administration.
- IRI/CCSR (2026). ENSO Forecast - Multi-Model Plume. International Research Institute for Climate and Society, Columbia University. Issued March 2026.
- NOAA CPC (2026). Weekly Niño Region SST Anomalies (OISSTv2). National Oceanic and Atmospheric Administration.
- Davey, M. et al. (2013). ENSO-related rainfall changes over the Indo-Pacific region. International Journal of Climatology, 34(3), 520–533.
- Copernicus Climate Change Service (2025). 2024: the first year to exceed 1.5 °C above pre-industrial level. European Centre for Medium-Range Weather Forecasts.
- Cai, W. et al. (2021). Changing El Niño–Southern Oscillation in a warming climate. Nature Reviews Earth & Environment, 2, 628–644.
- NOAA Pacific Marine Environmental Laboratory (2023). The El Niño Story. National Oceanic and Atmospheric Administration.
- Ham, Y.-G., Kim, J.-H. & Luo, J.-J. (2019). Deep learning for multi-year ENSO forecasts. Nature, 573, 568–572. SNU ACE Lab CNN forecast issued April 2026, extending to March 2028.