
Extreme Weather Events
About 375 weather disasters a year were recorded worldwide in 2016-25, close to 362 a year in 2000-09 - the earlier rise was mostly better reporting - and in the last 30 days GDACS raised three Red alerts, all tropical cyclones.
Live alerts from GDACS grade each flood, storm, drought and wildfire by its likely impact as it unfolds - an early estimate, not a confirmed disaster. EM-DAT records the weather and climate disasters afterwards: every one since 1900 that killed 10 or more people, affected 100 or more, or needed outside help. Under the map, Climate Drivers Now shows which alerts fit El Niño’s, the Indian Ocean Dipole’s or the North Atlantic Oscillation’s usual pattern.
Current State
Alerts from GDACS (UN and European Commission), graded by how likely each event is to need international help.
Red Alerts
0Major Events
Active Now · 3 in the Last 30 Days
Orange Alerts
4Severe Events
Active Now · 4 in the Last 30 Days
Green Alerts
18Moderate Events
International help unlikely needed
All Alerts
22Alerts
Every level, active now
Reading the Map
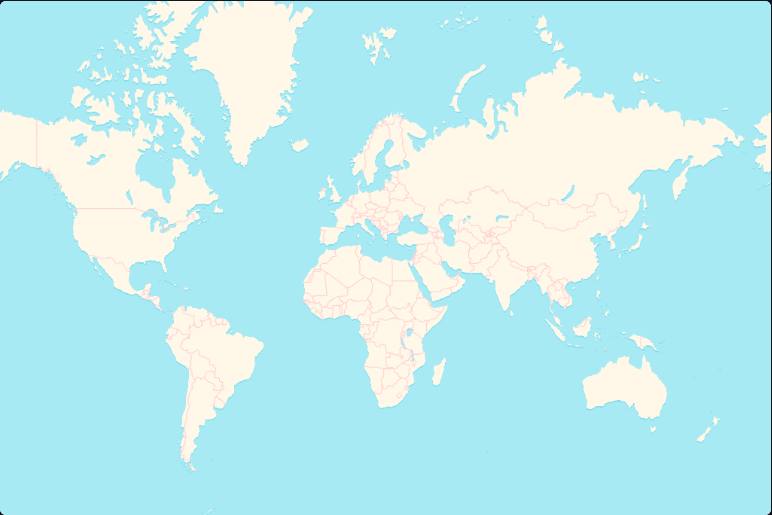
- Each alert, coloured by GDACS’s level - red, orange or green. The icon is the hazard.
- A number - many alerts of one kind in one area, mostly wildfires. Pick it for the list.
- Pick a cyclone under Tracking Now for its track and forecast.
- Sea Temp - today’s sea surface against its 1991-2020 normal. Warmer seas feed stronger cyclones and heavier rain.
Key Terms
- GDACS
- - The Global Disaster Alert and Coordination System, run by the UN and the European Commission.
- Red
- - A major event - international help likely needed.
- Orange
- - A severe event - international help may be needed.
- Green
- - A moderate event - help unlikely to be needed. Most wildfires are here.
- Fits Its Pattern
- - Climate Drivers Now - an alert that is a hazard the driver’s phase usually brings to that place in that season. Context, not cause.
Global Disaster Alert and Coordination System, GDACS (UN OCHA, UNOSAT and the European Commission), refreshed every half hour. Green wildfire alerts update daily.
Climate drivers - ENSO from NOAA CPC’s RONI, the IOD from the Bureau of Meteorology’s weekly DMI, the NAO from NOAA CPC’s daily index (30‑day mean). An alert fits a driver by the ENSO, IOD and NAO pages’ own test of how each phase moves each place’s rain and temperature. Sea Temp - NOAA OISST v2.1, daily, against 1991-2020.
GDACS alerts are model estimates, given as is - not a substitute for official warnings. Always follow local and national authorities (terms of use).
What It MeansWhat It Means - Extreme Weather Briefing
Right now
In the last 30 days GDACS raised Red alerts for Tropical Cyclone Murasu and Tropical Cyclone Arnab, both in India, and for Tropical Cyclone Champi, which covered the Philippines, Guam, Japan, China and South Korea. Orange drought alerts cover parts of East Africa, Central America, Europe and northern South America.
The drivers behind it
Only one recent alert fits the usual pattern of an active driver. Tropical Cyclone Isaias in the United States fits the usual pattern of a Positive Atlantic Multidecadal Variability in its season. This is context, not cause, so it says nothing about why that storm formed.
The long view
EM-DAT shows no clear trend in counts since 2000. Deaths fell from 55,668 a year in the 1970s to 18,549 in the 2010s, while damages rose from $4bn to $130bn, not adjusted for inflation. The rise in counts before 2000 was mostly better reporting.
What to watch
A Very Strong El Niño usually brings flood risk to coastal Peru and Ecuador in Jan-Mar, and to the Central Tropical Pacific Islands in Dec-Feb. It tends to bring drought to Southern Africa in Dec-Feb and to NE Brazil in Feb-Apr. These are odds from past events, not a forecast. See ENSO Tracker.
Written by Claude from this page's own data, every figure checked against it · 22 Nov 2026
Past Alerts
Alerts by MonthAlerts by Month - Last 12 Months
Every alert by the month it began and by continent, so each region's season shows. Each chart has its own scale.
Wildfires
7,933
Peak Aug 2026
Floods
641
Peak Jun 2026
Cyclones
101
Peak Aug 2026
Droughts
14
Peak May 2026 · 13 monitored
Last 12 Months
Major + Severe -1514154
Now - the Atlantic and East Pacific hurricane seasons end on 30 Nov as the southern season - Australia, the South Pacific, Madagascar - begins, running to April. El Niño usually brings fewer Atlantic hurricanes, more in the Central Pacific, and South Pacific cyclones further east, fewer for Australia.
Last 12 Months
Now - the Atlantic and East Pacific hurricane seasons end on 30 Nov as the southern season - Australia, the South Pacific, Madagascar - begins, running to April. El Niño usually brings fewer Atlantic hurricanes, more in the Central Pacific, and South Pacific cyclones further east, fewer for Australia.
Global Disaster Alert and Coordination System, GDACS, alerts by month.
Alert Archive
Every Red and Orange alert since 2017, and every cyclone of the last 12 months, once it has ended - to look up a past event, or watch years of them on the map.
Since 2017561 Alerts
Global Disaster Alert and Coordination System, GDACS. Starts in 2017, when GDACS's records become complete. Of the Green alerts, only the last 12 months' cyclones are kept. Alerts still active are on the map above until they end.
Global & Local
Alerts & Disasters - Global
GDACS alerts worldwide - the last 30 days and each year since 2017 - and every weather disaster since 1900 (EM-DAT: 10+ deaths, 100+ affected or an emergency declared).
Alerts
Major & Severe Alerts Worldwide
Red (Major) and Orange (Severe) GDACS alerts by the year they began - what GDACS issued, not a climate trend. Its coverage has grown (wildfires from 2021, most droughts from 2018-20, more floods from 2019), so years aren’t like for like. Cyclones are the steadiest.
Disasters
Disasters Each Year Since 1960, by Type
2025 - 377 disasters (level with the 10‑year average), 35K deaths, 110M people affected and $159B in damages.
Any long-term change? No clear trend in disasters since 2000, from 362 a year in 2000-2009 to 375 in 2016-2025. Earlier counts rose mostly because reporting improved, so the test starts in 2000.
Trends by Type - Disasters per Year Since 1980Disasters a Year · Figures are the 2016-2025 average
All Weather Disasters
375 per year
Flood
167 per year
Storms & Cyclones
122 per year
Drought
25 per year
Wildfire
16 per year
Extreme Temperature
26 per year
These charts count disasters, not weather. EM-DAT records an event when it kills ten people, affects a hundred, or brings an emergency declaration or a call for international help (EM-DAT). So a count also moves with how many people are in harm’s way and how well events are reported. The assessments below are of the hazards themselves, worldwide.
- All Weather Disasters - EM-DAT puts the rise in its counts down to better reporting, not more disasters, and advises leaving out the years before 2000 when looking for a trend (EM-DAT). Deaths fell almost threefold from 1970 to 2019 as early warnings improved (WMO, 2021).
- Flood - Heavy rain has become more frequent and intense since the 1950s over most land with good records (IPCC AR6, 2021). For river floods the IPCC’s confidence in any global trend is low, with peak flows up in some regions and down in others (IPCC AR6, Chapter 11). Fewer recorded flood disasters is not less heavy rain.
- Storms & Cyclones - The IPCC has low confidence in any long-term trend in the number of tropical cyclones. What has likely risen over the last four decades is the share reaching Category 3-5, and warming makes their rain heavier (IPCC AR6, 2021). The rise in this count is not evidence of more cyclones.
- Drought - The yearly counts are small, so they swing widely. Warming has added to agricultural and ecological drought in some regions, by drying the land faster (IPCC AR6, 2021).
- Wildfire - Fire weather - hot, dry and windy together - has become more likely in some regions of every inhabited continent (IPCC AR6, 2021). The most extreme fires became 2.2 times as frequent from 2003 to 2023 (Cunningham et al. 2024), while the world’s burned area fell by about a quarter from 1998 to 2015, most of all in savannas, as farming spread (Andela et al. 2017).
- Extreme Temperature - The firmest trend of the six. It is virtually certain that hot extremes have become more frequent and more intense over most land since the 1950s, with human influence the main driver (IPCC AR6, 2021). The record still misses many heatwaves: a 2020 study found only two in it for sub-Saharan Africa since 1900 (Harrington & Otto 2020).
Emergency Events Database (EM‑DAT), CRED / UCLouvain, Brussels, Belgium, accessed 2026 via Our World in Data, under EM-DAT’s terms of use. 2026 is provisional - EM-DAT keeps adding a year’s disasters for a year or two afterwards. Earthquakes, volcanoes and other geophysical disasters are left out.
Hardest Hit
Ten Worst-Affected Countries, 2016-2025
Totals over the last ten complete years. Pick a country to open its record above.
Top 10 by Deaths
Europe leads because EM-DAT counts its heatwave deaths from excess-death studies (2022-24). Most heat deaths elsewhere go uncounted.
Emergency Events Database (EM‑DAT), CRED / UCLouvain, Brussels, Belgium, via Our World in Data.
Totals favour large countries, and damages (in US dollars) rich ones.
Is It Climate Change?
Linking Disasters to Warming
How scientists link individual disasters to warming - and how to read the long-term counts.
Attribution Science
Attribution studies compare the climate we have with one without human warming, to measure how much more likely or intense an event became. World Weather Attribution publishes rapid studies of major events, and Carbon Brief’s attribution map gathers hundreds of them in one place. ClimaMeter adds quick analyses of European and global events.
What the IPCC Says
“Human-induced climate change is already affecting many weather and climate extremes in every region across the globe. Evidence of observed changes in extremes such as heatwaves, heavy precipitation, droughts, and tropical cyclones, and, in particular, their attribution to human influence, has strengthened since AR5” (IPCC AR6, 2021).
Which Extremes Have Changed?
Hot extremes have grown more frequent and intense over most land since the 1950s, and heavy rain has too wherever records are good. Droughts have risen in some regions, and a larger share of cyclones now reach Category 3-5. The evidence is weakest for river floods and for the number of cyclones (IPCC AR6, 2021). The disaster counts above also rose with better reporting. Long-Term Test
Reading the Damage Figures
Damages are in US dollars of the day, not adjusted for inflation, and they follow wealth: a storm hitting a rich coast costs more than the same storm hitting a poor one. Deaths, meanwhile, have fallen sharply since the mid-20th century as forecasts and warnings improved, even as some hazards grew more intense.
Explore
Where Next
- Sea & Ice
Sea level rise and what drives it - warming water, glaciers and ice sheets - and sea ice at both poles
- Coral Bleaching Tracker
Daily heat stress for 214 reef regions, bleaching alerts and the NOAA four-month outlook
- Indian Ocean Dipole
The Indian Ocean's own ENSO - the East Africa vs Indonesia and Australia rainfall seesaw
- NAO Tracker
North Atlantic Oscillation - a key driver of Europe's winds, storms and winter weather