
Extreme Weather Events
Live alerts from GDACS grade each flood, storm, drought and wildfire by its likely impact as it unfolds - an early estimate, not a confirmed disaster. EM-DAT records the weather and climate disasters afterwards: every one since 1900 that killed 10 or more people, affected 100 or more, or needed outside help.
Current State
Alerts from GDACS (UN and European Commission), graded by how likely each event is to need international help.
Red Alerts
1Major Event
International help likely needed
Orange Alerts
1Severe Event
International help may be needed
Green Alerts
6Moderate Events
International help unlikely needed
All Alerts
8Alerts
Every level, active now
Alerts on the Map
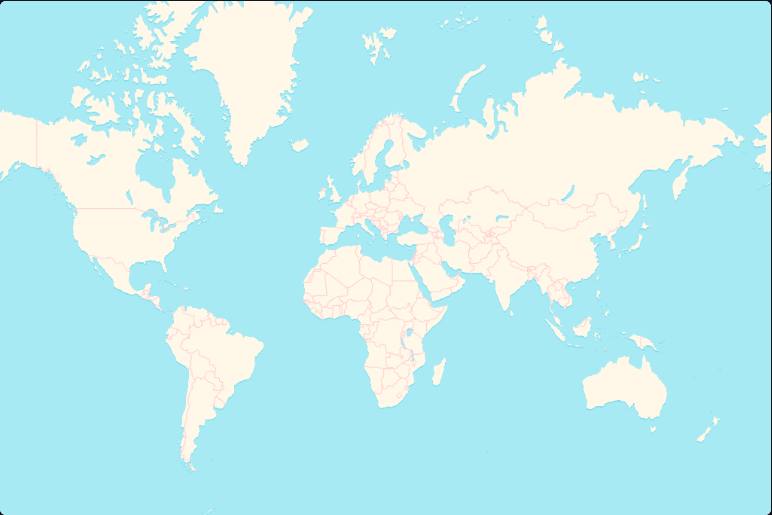
Events8 Alerts
Source: Global Disaster Alert and Coordination System, GDACS (UN OCHA, UNOSAT and the European Commission), refreshed every half hour; Green wildfire alerts update daily. GDACS alerts are model estimates, given as is - not a substitute for official warnings; always follow local and national authorities (terms of use).
Past Alerts
Alerts by Month - the Last 12 Months
Every alert, at every level, by the month it began and by continent - so each region's season shows. Each chart has its own scale.
Wildfires
7,297
Peak: Aug 2026
Floods
634
Peak: Jun 2026
Cyclones
95
Peak: Aug 2026
Droughts
17
Peak: Nov 2025
Last 12 Months
Major + Severe:1617155
Last 12 Months
Source: Global Disaster Alert and Coordination System, GDACS.
Alert Archive
Every Major and Severe alert since 2017, and every cyclone of the last 12 months - to look up a past event, or watch years of them on the map.
Since 2017554 Alerts
Source: Global Disaster Alert and Coordination System, GDACS. Starts in 2017, when GDACS's records become complete. Of the Moderate (Green) alerts, only the last 12 months' cyclones are kept.
Global & Local
Alerts & Disasters - Global
GDACS alerts worldwide (the last 30 days, and each year since 2017), and every weather and climate disaster since 1900 in the international disaster database EM-DAT: 10 or more deaths, 100 or more people affected, or a declared emergency or call for international help.
Alerts
Major and Severe Alerts Worldwide, by Type
Red (Major) and Orange (Severe) GDACS alerts by the year they began - what GDACS issued, not a measure of climate change. What it grades has changed (wildfire alerts from 2021, most droughts in 2018-2020, fewer floods before 2019), so the years aren’t like for like; cyclones are the steadiest record.
Disasters in 2024 - the Latest Complete Year · latest full year
Disasters
418
+12% vs 10-yr avg
Deaths
79K
+167% vs 10-yr avg
People Affected
170M
+7% vs 10-yr avg
Damages
$224B
+29% vs 10-yr avg
Disasters Each Year Since 1960, by Type
Trends by Type - Disasters per Year Since 1980 · Figures are the 2015-2024 average
All Weather Disasters
372 per year
Flood
170 per year
Storms & Cyclones
117 per year
Drought
27 per year
Wildfire
15 per year
Extreme Temperature
23 per year
Source: Emergency Events Database (EM-DAT), CRED / UCLouvain, Brussels, Belgium, accessed 2026 via Our World in Data, under EM-DAT’s terms of use. 2025 is provisional - EM-DAT keeps adding a year’s disasters for a year or two afterwards. Earthquakes, volcanoes and other geophysical disasters are left out.
Hardest Hit
Ten Worst-Affected Countries, 2015-2024
Totals over the last ten complete years. Pick a country to open its record above.
Top 10 by Deaths
Source: Emergency Events Database (EM-DAT), CRED / UCLouvain, Brussels, Belgium, via Our World in Data. Europe leads on deaths because EM-DAT counts the heatwave deaths of the 2022-24 summers. Totals favour large countries, and damages (in US dollars) rich ones.
Is It Climate Change?
Linking Disasters to Warming
How scientists link individual disasters to warming - and how to read the long-term counts.
Attribution Science
Attribution studies compare the climate we have with one without human warming, to measure how much more likely or intense an event became. World Weather Attribution publishes rapid studies of major events, and Carbon Brief’s attribution map gathers hundreds of them in one place. ClimaMeter adds quick analyses of European and global events.
What the IPCC Says
“Human-induced climate change is already affecting many weather and climate extremes in every region across the globe. Evidence of observed changes in extremes such as heatwaves, heavy precipitation, droughts, and tropical cyclones, and, in particular, their attribution to human influence, has strengthened since AR5” [IPCC AR6, 2021].
More Disasters, or Better Reporting?
Recorded disasters rose steeply from the 1960s to the 2000s, but much of that rise is better reporting - more countries, better communications, more aid agencies logging events. Our World in Data warns the historical increase “largely reflects improvements in data reporting”. Compare recent decades with each other, not with the 1960s.
Reading the Damage Figures
Damages are in US dollars of the day, not adjusted for inflation, and they follow wealth: a storm hitting a rich coast costs more than the same storm hitting a poor one. Deaths, meanwhile, have fallen sharply since the mid-20th century as forecasts and warnings improved, even as some hazards grew more intense.