Warmest Spring in 86 Years. Negative NAO. What's Going On in Iceland?

Iceland rarely makes global headlines for its weather. It's a small island nation in the high North Atlantic, remote enough that its temperature records tend to stay out of the international news cycle. Yet right now Iceland is heading for its warmest year on record, and the scale of the anomaly tells us something important about where the whole planet is going. Iceland, it turns out, is a canary in the coal mine for climate change - it feels the effects of warming earlier and more intensely than most of the world. Understanding why tells us a lot about what's coming for the rest of us.
The Numbers from May
May 2026 was Iceland's warmest May in 86 years of data. The average temperature of
6.51 °C (43.7 °F)
represented an anomaly of
+5.15 °C (+9.3 °F)
above the 1961–1990 baseline. Iceland ranked first among 234 countries and US states for the size of its monthly departure from normal.[1]
The global land temperature anomaly for the same month was
+1.20 °C (+2.2 °F).
Iceland's anomaly was more than four times the size of the global land average - the departure from normal, not the temperature itself.
The three-month period from March to May was also Iceland's warmest spring on record, at
+4.0 °C (+7.2 °F)
above baseline. Through 2026 so far, the country sits at number one in the historical rankings, on course for its warmest year ever recorded.
May 2026 in context
May 2026 was the 2nd warmest May on record globally, with a combined land and ocean surface temperature anomaly of +0.93 °C (+1.7 °F) above the 1961–1990 baseline. The 10-year rolling mean (2016–2025) now stands at +1.41 °C (+2.5 °F) above pre-industrial levels, within touching distance of the 1.5 °C (2.7 °F) threshold set by the Paris Agreement.
Why Iceland Runs Ahead
This isn't coincidence, and it's not a one-off. Iceland sits at the southern edge of the Arctic amplification zone, where the physics of warming play out faster and more visibly than almost anywhere else on Earth. When sea ice melts, it exposes darker ocean water that absorbs more solar energy than the reflective ice it replaced. That feedback accelerates local warming, which drives more ice loss, which accelerates warming further.[2] May 2026 was the third consecutive month in which Arctic sea ice extent ranked second-smallest on record - the mechanism driving Iceland's amplified warming is visibly active right now.[1]
For a long time the accepted figure was that the Arctic was warming roughly twice as fast as the global average. Recent research, published in Communications Earth & Environment, puts the ratio closer to four times, a higher amplification than even state-of-the-art climate models have been capturing.[3] The models, in other words, have been underestimating what's already happening.
Iceland is, in that sense, a climate canary - a place where the warning signs appear first, amplified, before they show up at full strength elsewhere. The data shows Iceland warming at roughly 2.4 times the global average rate over the past 75 years, its anomaly consistently running 1-2 °C (1.8-3.6 °F) above the global figure for most of the 2000s and 2010s. That's Arctic amplification in action: Iceland gets there first in magnitude. Year-to-year, though, the picture is noisier. The NAO sits at the epicentre of Iceland's variability and can push temperatures sharply cold even in a globally warm year. It's a canary for the destination, not the timetable.
A Summer That Now Starts in April
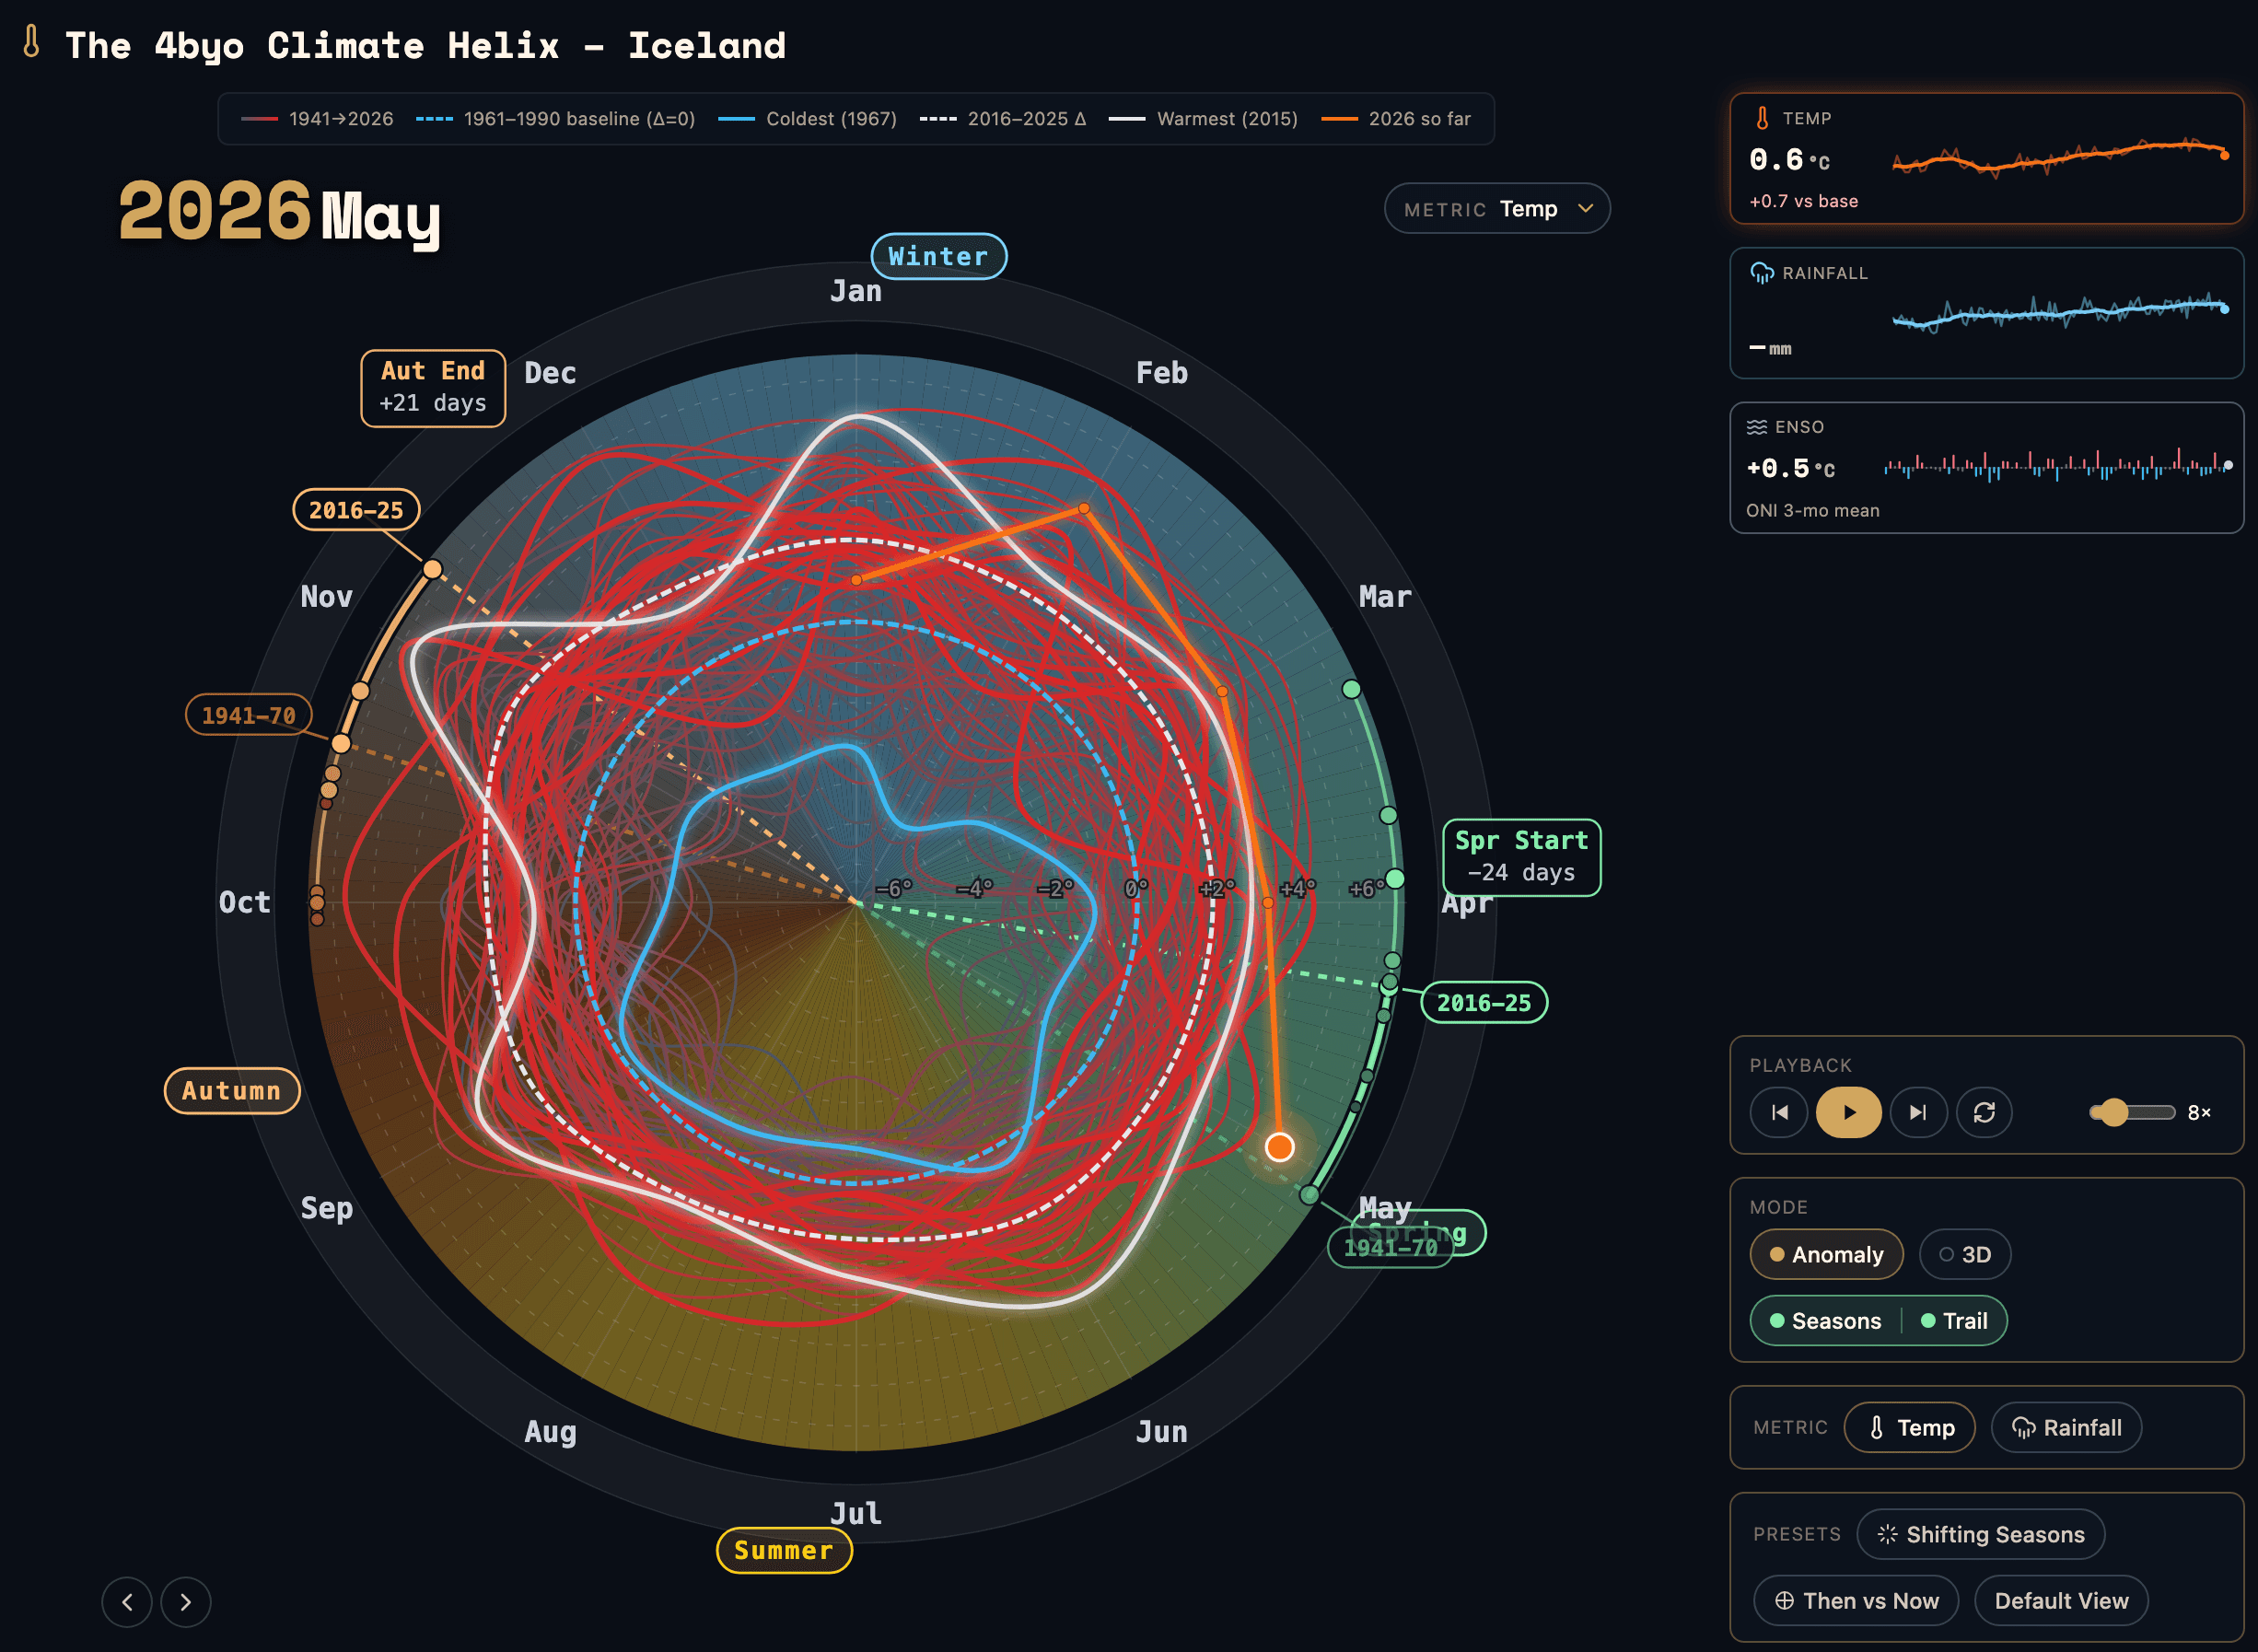
The Climate Helix for Iceland shows the shift visually. The tangle of red lines pushed well beyond the baseline ring through the spring months of 2026 is striking, but perhaps even more striking are the seasonal shift numbers alongside it. Spring (defined as the point when monthly temperatures first rise above the long-term annual mean) now starts 24 days earlier than it did in the 1941–70 baseline period. Autumn ends 21 days later. Iceland's warm season has extended by 45 days in total. To put that concretely: what used to run from late May to mid-September now runs from mid-April to early October. A generation ago, Iceland barely had a spring. Now it has one that arrives before Easter.
February stands out in the month-by-month data as the single biggest warming signal, at
+2.8 °C (+5.0 °F)
against baseline. That's consistent with a well-documented pattern: Arctic amplification is strongest in winter, when sea ice loss removes the insulating cap that previously contained ocean heat.
Warm Despite Everything
Here's what makes May 2026 more than a record in a warm year. Iceland sits at the epicentre of the North Atlantic Oscillation pressure system, and the NAO is the dominant driver of Iceland's year-to-year temperature variability - strong enough in most years to swamp the background warming signal. In May 2026, the NAO was in negative phase at
−0.74.
The Pacific-North American pattern (PNA) was also strongly negative at
−1.27,
another circulation pattern that typically suppresses warmth in the North Atlantic sector. Both indices are tracked in real time on the 4byo Climate Symphony. A negative NAO should cool Iceland. A strongly negative PNA compounds that. Something overrode both.
A rough calculation illustrates the scale of that override. If Iceland amplifies at 2.4 times the global rate, and global land was at +1.20 °C (+2.2 °F) in May, you'd expect Iceland's anomaly to land around +2.9 °C (+5.2 °F). It came in at +5.15 °C (+9.3 °F). Nearly twice what amplification alone would predict - against a NAO that was actively working against it. That excess is the real story. It suggests the background warming signal has reached a level where it can overpower even the NAO's cooling influence in negative-phase months. If that's a new threshold rather than a one-off, it matters.
Iceland wasn't alone in recording exceptional warmth that month. Tajikistan
(+4.88 °C / +8.8 °F)
and Uzbekistan
(+4.55 °C / +8.2 °F)
followed close behind in the global rankings, pointing to something broader at work across Eurasian land masses. Europe also saw an unusually early and intense heatwave in May, with records broken in France, the UK, Ireland and Portugal.[1]
Meanwhile, a cold blob of anomalously cool water has persisted in the North Atlantic south of Greenland and Iceland for the past year. Scientists are monitoring it for its possible connection to changes in the Atlantic Meridional Overturning Circulation - the system of deep ocean currents that has historically kept the North Atlantic mild. Iceland's Climate Council has explicitly called for stronger emissions cuts in response to evidence that AMOC is weakening. An AMOC slowdown or collapse would, paradoxically, deliver severe cooling to Iceland and northwestern Europe. That makes the current anomalous warmth, against a negative NAO backdrop and a cold surrounding ocean, genuinely hard to read.
A Test Case for Machine Learning
The same warming staircase that amplifies Iceland's spring anomalies also sets the floor for the next El Niño - and that El Niño is now officially here. On 11 June 2026, NOAA's National Weather Service issued an El Niño Advisory, formally declaring that El Niño conditions have developed in the tropical Pacific.[5] Forecasters expect it to intensify to moderate or strong levels this autumn, with a 63% chance that sea surface temperatures in the monitored region will exceed 2.0 °C above normal - NOAA's threshold for a "very strong" event. That context makes one of the most interesting features of the 4byo Climate Symphony particularly timely. Alongside the official NOAA consensus forecast, the Symphony displays predictions from the SNU deep learning model developed by Ham et al. and published in Nature in 2019, a convolutional neural network trained on CMIP5 climate model output that projects Niño 3.4 sea surface temperature anomalies up to 17-18 months ahead.[4]
Right now the CNN is tracking close to the NOAA consensus but projecting a somewhat stronger El Niño peak, with its forecast envelope sitting above the official line through 2027. That gap is small but meaningful.
This matters beyond the immediate forecast. The 2023–24 El Niño caught many models off guard in its intensity. The current event, arriving against an already elevated global temperature baseline, is arguably the first major test of AI-assisted climate system prediction at scale, running in real time, with verifiable outcomes arriving month by month. Whether the CNN's stronger signal or the NOAA consensus proves closer to the mark will tell us something useful about where machine learning adds genuine skill to seasonal climate forecasting. Worth watching. Not just for what El Niño does to temperatures, but for what the comparison reveals about the tools themselves.
The Staircase
The Temperature Ratchet panel on the Climate Symphony shows how each significant El Niño event has left a higher global temperature floor than the one before. After the 1997–98, 2009–10, 2015–16 and 2023–24 events, temperatures never returned to the pre-event baseline during the following La Niña. Each event left a floor of +0.13, +0.08, +0.21 and +0.32 °C respectively above the previous level. A new El Niño stepping onto that staircase now, with the 10-year rolling mean already at +1.41 °C (+2.5 °F) above pre-industrial, is the context in which Iceland's record spring needs to be read.
Sea level and ice data carry the same direction of travel. Greenland's ice sheet, directly north of Iceland, is among the largest contributors to current sea level rise. Melt from the 2009–2019 decade alone has already locked in a measurable future rise regardless of what happens to emissions from here. The 4byo Sea Levels and Ice page tracks those signals monthly.
Iceland won't dominate the global temperature rankings every month. Internal variability means individual seasons will continue to show noise in both directions. But the underlying signal - visible in the Helix spiral, in the shifting season dates, in February's +2.8 °C (+5.0 °F) - is not noise. It's a structural shift, playing out fastest at the edge of the Arctic, and legible in the data for anyone who knows where to look.
Explore the Data
- Iceland climate profile - temperature anomalies, seasonal shifts and emissions
- 4byo Climate Helix - year-on-year temperature spiral for Iceland and 160+ regions
- 4byo Climate Symphony - ENSO, NAO, AMV and polar vortex on one timeline, plus the Temperature Ratchet and SNU CNN forecast
- ENSO Tracker - live El Niño state and NOAA forecast
- Global climate update - May 2026 numbers in full
- Sea Levels and Ice - Greenland melt, Arctic sea ice and global mean sea level
- Climate Rankings - league table of anomalies across 234 countries and US states
References
- 4 Billion Years On (2026). Global Climate Update, May 2026. 4billionyearson.org. Data sourced from NOAA Climate at a Glance and Copernicus ERA5.
- NASA Earth Observatory (2026). Arctic Amplification. NASA Goddard Institute for Space Studies.
- Rantanen, M. et al. (2022). The Arctic has warmed nearly four times faster than the globe since 1979. Communications Earth & Environment 3, 168.
- Ham, Y.-G., Kim, J.-H. & Luo, J.-J. (2019). Deep learning for multi-year ENSO forecasts. Nature 573, 568–572.
- NOAA National Weather Service (2026). El Niño forms, expected to strengthen, say NOAA forecasters. National Oceanic and Atmospheric Administration. 11 June 2026.