
Pacific-North American Pattern
As of 9 Nov, the Pacific-North American pattern (PNA) is Positive as winter begins - NOAA's two-week forecast eases it to Neutral by 26 Nov, and El Niño pulls it Positive while the PDO pulls the other way.
PNA Now and Next
- Now · NOAA CPC, measured to 9 Nov
- Positive PNA · as winter beginsCurrent State
- Weeks ahead · NOAA GEFS, 11 Nov run
- PNA easing to Neutral by 26 NovForecast
- Months ahead · NOAA, issued Oct
- El Niño until about Apr-Jun · a lean to +PNA this winter (9 of 14 strong PNA winters) · the PDO (−2.3) leans against itWhat It Brings
- Usually · winters since 1950
- 9 strongly Positive PNA winters since 1950 · Western & Central Canada's Dec-Feb temperature in the warmest third in 17 of 24 Positive winters · Hawaii's Jan-Mar rain in the driest third in 16 of 23 Positive wintersStrongest Winters
What It Is - A chain of high and low pressure in the upper air from near Hawaii, past the Aleutians and western Canada, to the south-east US - the main route by which El Niño and La Niña reach North American winters.
How It’s Measured - NOAA CPC matches each day’s upper-air pressure pattern (500 hPa heights) across the Northern Hemisphere against the PNA’s shape. The index is standardised, so ±1 is a strong day. The site judges a winter by its Dec-Feb mean.
What Drives It - Mostly the tropical Pacific. El Niño’s warm water feeds thunderstorms over the central Pacific that send a wave along the jet stream, pushing the PNA Positive. La Niña leans it Negative. The PDO adds a slower tilt, and day to day the weather’s own swirls move it, so it can change within a week.
What It Brings - A Positive PNA - mild western Canada and Alaska, a cold, wet south-east US. A Negative PNA flattens the flow and lets Arctic air into the north-west.
On This Page - The live NOAA daily index and its 15-day forecast, a map of today’s alerts, what ENSO and the PDO usually bring it, every winter since 1950, its strongest winters and the places it drives most.
Current State
Pressure from Hawaii to the south-east US - it shapes the jet stream over North America in winter.
PNA State
49% Neutral by 26 NovPNA +1.50 9 Nov · 30-day +0.53 · Oct +0.28
Ridge west, trough east - mild NW, cold and wet in the south
ENSO · Partner
LikelyPeak+2.0°CRONI Aug-OctEl Niño · Very Strong
El Niño · Very Strong
Winter leans +PNA r +0.36 · ENSO ↗
North Pacific & North America
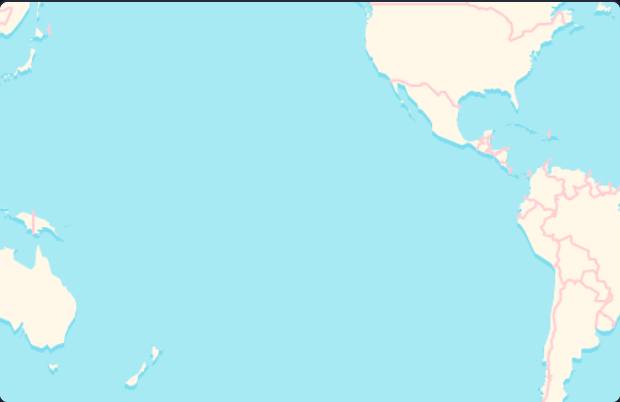
Reading the Map
- The four centres - Hawaii, the Aleutians, western Canada and the south-east US. In a positive phase pressure is higher at the first and third, lower at the others. The PNA is now +1.50.
- The jet stream - a ridge over the west and a dip over the east in a positive phase, flatter across the continent in a negative one.
- What the phase usually brings in winter - milder or colder, wetter or drier.
- Alerts since 14 Aug - 5 in its reach, none PNA-linked (not hazards the phase usually brings there).
Key Terms
- Pacific-North American pattern
- - A wave of high and low pressure from Hawaii to the south-east US. It sets the shape of the jet stream over North America.
- Positive PNA
- - A ridge over the west and a trough over the east - mild in western Canada and Alaska, cold and wet in the south.
- Negative PNA
- - Flatter Pacific flow - cold in the north-west and the Prairies, mild and dry in the south-east.
- ENSO and the PDO
- - El Niño and a warm PDO tilt the winter PNA positive (r +0.36 and r +0.57). La Niña and a cool PDO tilt it negative.
- The season
- - Strongest Nov-Mar, and weak in summer. Beyond ±0.5 counts as a phase.
PNA Sign Flip
The PNA turned from Negative to Positive on 30 Oct and has held for five days or more - often a real change in the jet stream rather than weather noise.
Positive at ≥ +0.5σ, Negative at ≤ −0.5σ, otherwise Neutral.
NOAA CPC daily PNA and monthly PNA, and NOAA NCEI’s PDO index.
Alerts from GDACS (Orange and Red), flagged PNA-linked when the hazard fits how the PNA’s phase in that month usually moves the place, on the site’s own measured links.
What It MeansWhat It Means - PNA Briefing
For the weeks ahead
It is November, and the PNA is Positive as its winter season gets under way. NOAA's two-week forecast takes it to Neutral by 26 Nov. The Positive spell is forecast to fade. While it lasts, a Positive PNA usually brings milder weather to Western Canada, Alaska and the north-west US. The Gulf of Alaska and coastal BC turn wetter and stormier. A Negative PNA would bring colder air south into the Prairies.
The partners
ENSO is a Very Strong El Niño, and that usually comes with a Positive PNA. The Pacific Decadal Oscillation (PDO), a slow North Pacific sea temperature pattern, has been Cool since November 2017. A Cool PDO leans towards a Negative PNA. So the two pull against each other. The PDO link was on the expected side in 13 of 14 strong PNA winters.
How this compares
Since 1950, 9 winters were strongly Positive and 5 strongly Negative. In 1976-77, a Positive PNA winter, Western Canada ran +2.8°C and Alaska +4.5°C against normal. Montana's rainfall was -43%. In 1971-72, a Negative PNA winter, Western Canada ran -4.2°C.
What to watch
The daily PNA index and NOAA's forecast update each day. NOAA's next ENSO outlook is due 12 Nov. The PDO's next monthly value comes early in December. The second week of the forecast is far less certain than the first.
Written by Claude from this page's own data, every figure checked against it · 12 Nov 2026
PNA Forecast
PNA - Observed & Forecast
The daily PNA and its 30-day mean, carried into NOAA's 15-day GEFS ensemble forecast - solid observed, dashed forecast.
What's Coming
GEFS ForecastNOAA GEFS Forecast
Neutral by 26 Nov+0.47Day 15 · strongest +1.58 on 12 Nov
The 31-member ensemble keeps the PNA near Neutral through to 26 Nov. By then 3% of members are below −0.5 and 48% above +0.5. Run of 11 Nov.
30-Day Mean & Skill
+0.53 → +0.92now to 26 Nov
The 30-day mean sets the phase shown here, and the forecast raises it. Over 111 runs the 7-day forecast tracked what happened closely (r 0.75, right side of zero 89% of the time), the 14-day far less (0.26, 63%) - a guide for week one, a hint for week two.
Day-by-Day PNA Phase Odds · 31 Members
Forecast: NOAA CPC GEFS ensemble (31 members, 0-15 days, issued daily); 90% range from the 5th to 95th percentile of members; skill from every run since 15 Jul 2026 against the observed index. Observed: NOAA CPC daily PNA, about 3 days behind (gold band).
What the PNA Usually Brings
ENSO, the PDO and the Winter PNA
Every El Niño winter since 1950 on one calendar, Sep-May - the PNA, then the PDO - with this winter and NOAA’s forecast dashed, then each winter by its partners.
This Winter
A Very Strong El Niño, but with a Cool PDO. At −2.26 in October, it is cooler than in any El Niño winter since 1950. In the 6 past El Niño winters with a Cool PDO, the PNA was Positive in only 3, averaging −0.07. So far its 30-day mean is +0.53.
What That Means - The two partners pull against each other, so the usual El Niño pattern is less certain than its strength alone suggests - the mild north-west and wet south may come weaker, later or not at all.
Usually - El Niño pushes the winter PNA Positive - in 15 of 26 winters since 1950, and 9 of 11 when the PDO is on the same side. That is the classic El Niño winter: mild in western Canada and Alaska, cool and wet across the southern US.
| PDO | El Niño | La Niña |
|---|---|---|
| Warm | +0.89+9 · −0 of 11 | +0.17+0 · −0 of 3 |
| Cool | −0.07Now+3 · −2 of 6 | −0.20+2 · −5 of 17 |
| Neutral | +0.30+3 · −1 of 9 | +0.39+2 · −0 of 4 |
Across all 76 winters the PNA was Positive in 24 and Negative in 15. The table gives each pairing’s mean Dec-Feb PNA, and how many of its winters were Positive (+) and Negative (−).
The PNA is NOAA CPC’s index, each winter’s Dec-Feb mean, labelled by its December. A winter counts as El Niño or La Niña at a Nov-Jan RONI of ±0.5°C or beyond, and its PDO as warm or cool at a Dec-Feb mean of ±0.5 or beyond (NOAA NCEI, ERSST v5). The pairing follows Yu & Zwiers (2007): the PDO strengthens El Niño’s pull on the PNA when the two are in step, and weakens it when they are not.
History
The PNA Since 1950
Every winter since 1950, with the decades that leaned each way, the El Niño winters, those remembered for their weather and the monthly record.
Winters Since 1950
24 / 15 / 37+PNA, -PNA, Neutral
+PNA, -PNA, Neutral
Beyond ±0.5, of 76 winters
By Decade
+0.49 / −0.33The 2000s and the 1950s
The 2000s and the 1950s
6 of 10 winters +PNA in the 2000s, 1 of 10 in the 1950s
Year to Year
r +0.04Each winter largely its own
Each winter largely its own
Winter to winter
PNA Winters · Dec-Feb Mean, 1950-2025
Notable Winters
- 1955-56−1.48Alaska's coldest year ↗
- 1976-77+1.43The cold eastern winter of 1976-77 ↗
- 2015-16+1.43The 2015-16 El Niño winter ↗
Any Long-Term Change? - Yes - winters have leaned +PNA: +0.09 a decade since 1950, beyond what chance gives (p 0.01). +PNA winters - 10 in 1950-1987, 14 in 1988-2025. -PNA - 13, then 2. 15 of 26 El Niño winters had a Positive PNA, against 9 of 49 other winters.
NOAA derives the index from 500 hPa heights over the North Pacific and North America (rotated principal components).
NOAA CPC daily PNA and monthly PNA.
The PNA's Partners
The PNA and Its Partners - Every Winter Since 1950
The winter PNA beside ENSO and the PDO - where the bars line up with the shaded strong winters, the partner moves with the PNA.
- ENSO (RONI)Moderate Link
Partly Drives It · Same Winter
Nov-Jan · r +0.36 · same way in 9 of 14
- PDOClear Link
Both Ways
Dec-Feb · r +0.57 · same way in 13 of 14
| Partner | SONDJFMAMJJA | vs PNA | In Strong Winters | Link |
|---|---|---|---|---|
| PNA | The reference - the PNA’s Dec-Feb mean | |||
| ENSO (RONI)Partly Drives It · Same Winter | r +0.36 | Same way in 9 of 14 | Moderate Link | |
| PDOBoth Ways | r +0.57 | Same way in 13 of 14 | Clear Link | |
PNADec-Feb
ENSO (RONI)Nov-Jan, °C
PDODec-Feb
ENSO. El Niño tilts the winter PNA Positive, La Niña Negative - it is ENSO’s route into North America (Horel & Wallace 1981).
Same way in 9 of 14 strong PNA winters · r +0.36ENSO Tracker ↗
PDO. The North Pacific’s slow pattern and the PNA push each other - the PNA’s winds build the PDO, and a Cool PDO pulls the PNA Negative (Newman et al. 2016).
Same way in 13 of 14 strong PNA winters · r +0.57PDO Tracker ↗
The PNA is NOAA CPC’s index (monthly means of the daily index from 2026), each winter’s Dec-Feb mean, labelled by its December. ENSO is RONI at its Nov-Jan peak, the PDO NOAA NCEI’s ERSST v5 index over the same Dec-Feb.
“vs PNA” is the correlation over every complete winter since 1950. “In strong winters” counts the winters with the PNA beyond ±1.0 in which the partner went the same way, as the literature expects (Horel & Wallace 1981; Yu & Zwiers 2007). A Clear Link is r 0.4 or more at p < 0.01, a Moderate Link r 0.25 or more at p < 0.05. Shaded winters are those beyond ±1.0, the marked ones beyond ±1.2. The PDO and ENSO overlap - much of the PDO is ENSO’s echo in the North Pacific - so their links are not separate effects.
The arrow under each partner is the direction the science gives, with its source in How Each Partner Works; the Link badge is what this record measures. The two can differ - a one-way influence can still be faint by the time it reaches the PNA, so its verb follows the badge (Drives It, Partly Drives It, Tilts It).
Strongest Winters
Strongest PNA Winters - and What They Brought
Every winter with the PNA beyond ±1.0 since 1950, strongest first, with Western Canada, Alaska, Montana and Texas that winter.
Temperature against each place’s own trend, so decades compare fairly. Rain as a share of its 1961-1990 normal.
The PNA is NOAA CPC’s index, each winter’s Dec-Feb mean. Temperatures are Copernicus ERA5 and rain GPCC, by country region and US state, for the same Dec-Feb - temperature against each place’s own straight-line trend since 1950, rain as a share of its 1961-1990 normal. Typical is the mean over every winter of that kind in the list.
PNA-Driven Places
PNA’s Pull by PlaceHow Much the PNA Drives Each Place
Each place’s strongest 3-month link to the Pacific-North American pattern since 1950, beyond ENSO’s share - across North America and the North Pacific rim.
Most PNA-Driven Places
Strongest link, either measure
One entry per country, its strongest part. Figures - the share of each season’s swing the PNA explains beyond ENSO’s share. Tap a place for its figures, the arrow for the rest of the country.
Typical country’s share explained · strongest place
Figures are the share of a place’s year-to-year swing in that season that the PNA explains (r², 1950-present), the best of its twelve 3-month windows, after the long-term trend and ENSO’s share are taken out of both - so the PNA is credited only with what it adds to ENSO, whose route into North America it largely is. A Strong or Moderate tier also needs a second window to agree.
Ranked inside the PNA’s documented reach - North America, Hawaii and the North Pacific rim of East Asia, where its wave train reaches; places elsewhere can still be found in the search. A +PNA or -PNA season is a 3-month PNA mean of ±0.5 or beyond. Sources are NOAA CPC’s monthly PNA index, Copernicus ERA5 temperature and GPCC rainfall by country and US state.
Contains modified Copernicus Climate Change Service information 2026.
Regional Impacts
Where Does the PNA Bite Hardest?
What each PNA phase usually brings in winter (Nov-Mar), region by region.
+PNAToday
-PNA
Western Canada, Alaska, NW US
Milder
A ridge over the west draws Pacific air north - fewer deep freezes.
Colder
The ridge sits offshore and Arctic air spills south into the Prairies.
Gulf of Alaska, coastal BC
Wetter · stormier
A deep Aleutian Low steers Pacific storms north.
Drier
A weaker Aleutian Low - storms run further south.
Northern Plains, Upper Midwest
Drier
Northwest flow behind the western ridge - less snow.
Wetter · snowier
Flatter Pacific flow carries more storms inland.
South-central and SE US
Cooler · wetter
A trough over the east and an active southern storm track.
Milder · drier
The trough moves west - mild, dry spells in the south-east.
Tendencies, not forecasts.
From NOAA CPC’s PNA pattern page and Leathers, Yarnal & Palecki (1991, J. Climate), checked against the site’s own measured links (PNA‑Driven Places).
Explore
Where Next
- NAO Tracker
North Atlantic Oscillation - a key driver of Europe's winds, storms and winter weather
- Polar Vortex / AO
The stratospheric polar vortex and Arctic Oscillation, tracked daily
- Indian Ocean Dipole
The Indian Ocean's own ENSO - the East Africa vs Indonesia and Australia rainfall seesaw
- Global Climate Update
Whole-planet temperature, CO₂, sea ice and ENSO in one monthly update