
The 2026 El Niño, Stripped to the Science: The Signal, the Warming, and the following La Niña

A strong El Niño is coming ... probably a very strong one. That much is clear. News outlets and social media have been full of coverage, often mixing solid science with hyperbole and dramatic claims attributed to unnamed "scientists." This post cuts through the noise by focusing on what we actually know. That means separating the strength of the El Niño itself from the global warming background it is developing in, comparing it honestly with past events, and then adding the warming back in to assess its real-world impact. It also means looking beyond a single season, because a major El Niño is usually only the first half of the story.
Comparing an established AI forecast with the traditional physics ones also adds significant value.
First, what it isn't doing
Much of this summer's heat and wildfire coverage has been attributed to El Niño by some. That's largely incorrect, and worth clearing up from the outset. Part of the confusion is that forecasts of a strong El Niño are often blurred with what's happening today. In reality, the event remained weak through July, and El Niño's atmospheric influence is felt mainly during the Northern Hemisphere winter rather than mid-summer. The record heat earlier in 2026 developed before El Niño had become established, and World Weather Attribution (WWA) concluded that human-caused warming, not El Niño, was driving the current extremes.[1] El Niño's teleconnections have yet to fully emerge. Its influence comes later.
Step 1 ... How strong is the signal itself?
Since February 2026, NOAA's official ENSO index has been RONI (Relative Oceanic Niño Index), replacing the older ONI.[2] The change follows research by Tim Stockdale and colleagues, who showed that the traditional ONI had become increasingly distorted by the long-term warming of the tropical oceans. By removing that background warming, RONI provides a cleaner measure of the strength of El Niño and La Niña themselves, fundamentally changing how modern ENSO events should be interpreted and compared with the historical record. The timing is awkward ... just as a potentially major El Niño is developing, many headlines are likely to favour the larger, more familiar ONI values rather than a newer index that has yet to become widely established. Both indices begin with the same sea-surface temperature anomaly in the Niño 3.4 region. RONI then subtracts the warming across the tropical oceans and rescales the remainder. In other words, it removes the global warming background, leaving the strength of the El Niño itself. Many recent articles still quote ONI values, which increasingly overstate the strength of modern ENSO events while understating those from earlier decades. RONI provides a much fairer comparison across time, but to understand an event's real-world impact, the global warming background must then be added back in.
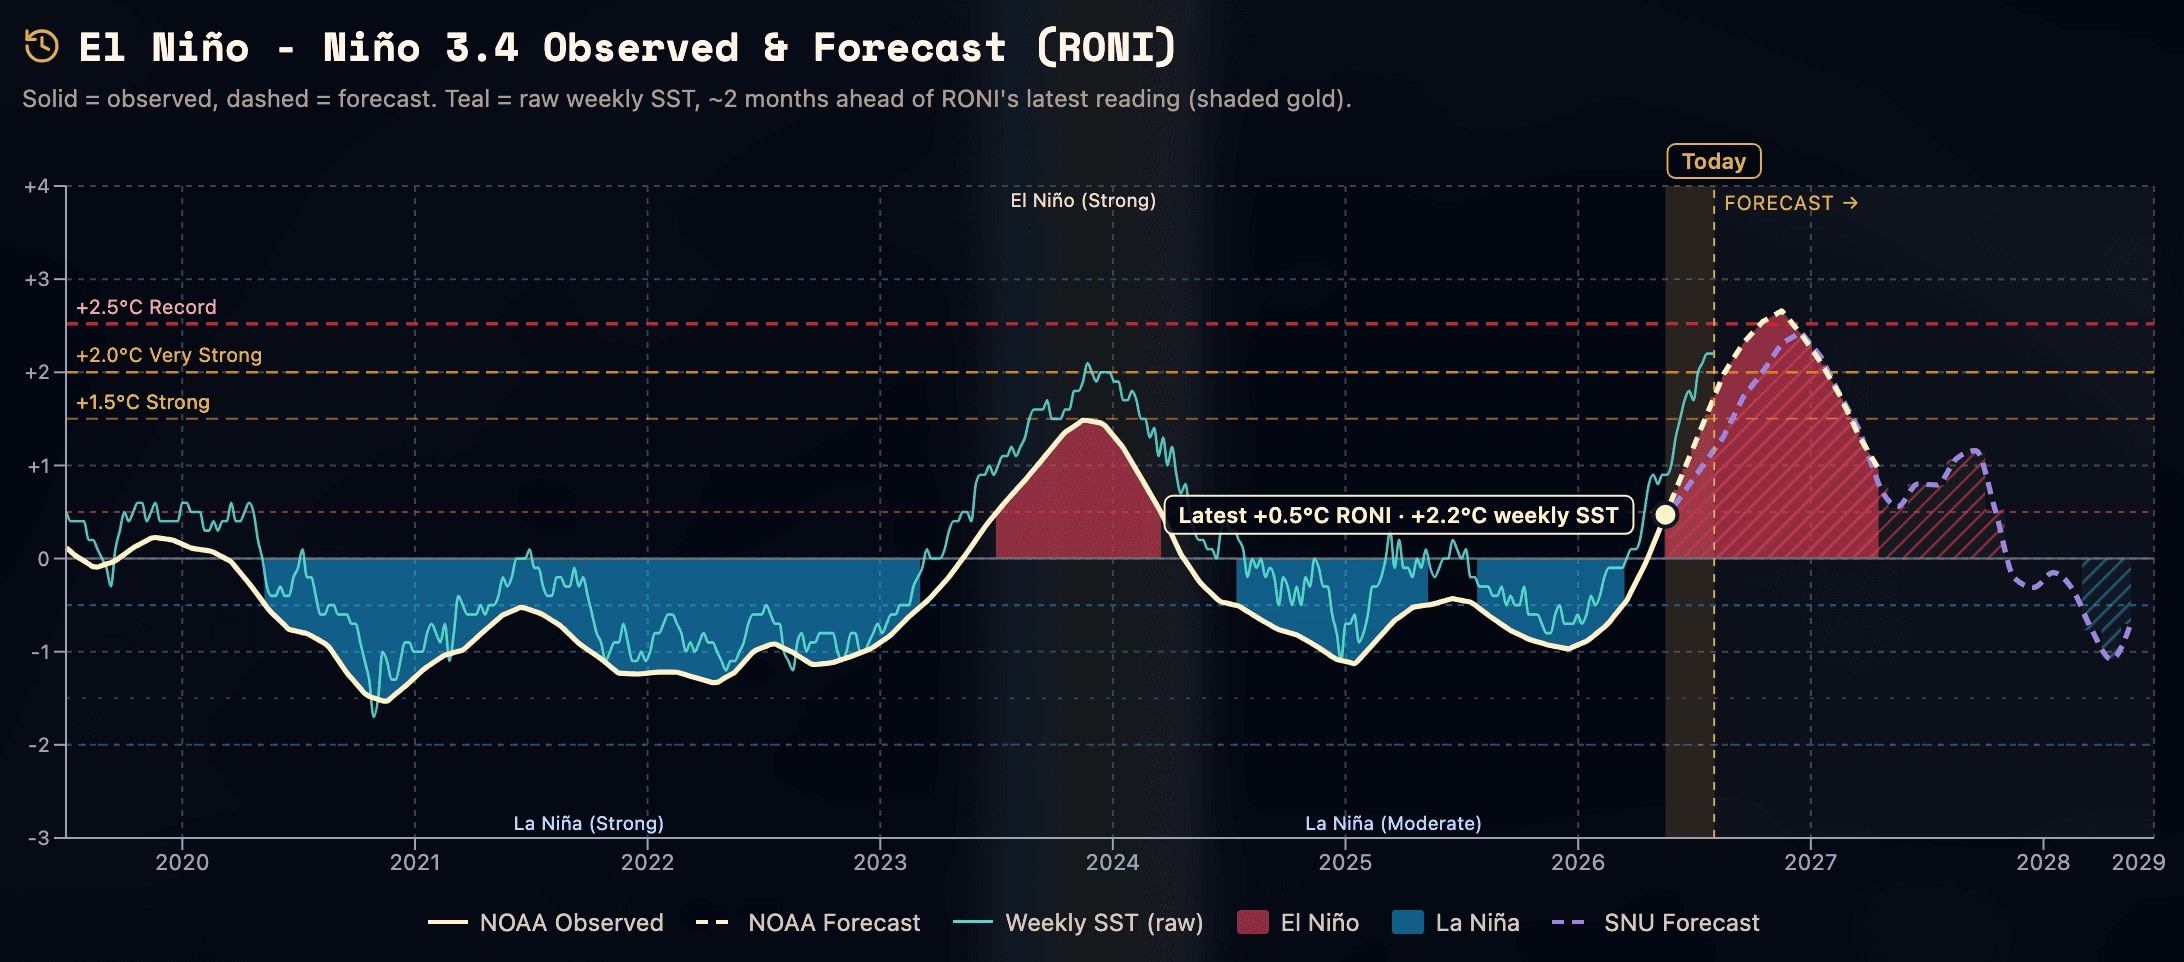
On that basis the event is still building. Weekly Niño 3.4 reached +2.2°C for the week ending 22 July,[3] while the lagged three-month RONI sat at +0.5°C for April to June.[4] The weekly figure is where the event is now; the seasonal index is where it was. Stripping the warming out also reshuffles the past. It trims recent events and lifts older ones: 2023-24 drops from "very strong" on ONI to "strong" on RONI, and 1991-92 moves up to "very strong" because the Mount Pinatubo eruption had cooled the surrounding tropics that year.
Step 2 ... Rank it against the past
Reduced to the signal, the current El Niño isn't in record territory yet, and the forecast peak sits alongside the strongest events rather than clear of them. On RONI the record since 1950 is 1982-83, at +2.5°C. The NOAA/IRI plume peaks near +2.7°C and the SNU CNN AI model near +2.4°C,[5][6] so the forecast brackets that record rather than blowing past it. On the raw ONI, which still carries the warming, a +3.1°C peak would be the highest ever recorded.[8] Same event, two answers. It's worth being explicit about which index a given "record" is using.
| Event | Peak RONI | Peak raw ONI | RONI class |
|---|---|---|---|
| 2026-27 (forecast) | +2.7°C | +3.1°C | very strong |
| 1982-83 | +2.5°C | +2.2°C | very strong (record) |
| 1997-98 | +2.4°C | +2.4°C | very strong |
| 2015-16 | +2.4°C | +2.8°C | very strong |
| 2023-24 | +1.5°C | +2.0°C | strong |
Peak RONI per episode with the un-adjusted Niño 3.4 (ONI) peak alongside. Forecast row is the NOAA/IRI plume central estimate. Source: NOAA CPC RONI and ONI v5.
Step 3 ... Add the warming back on
This is where the signal stops being the whole story. RONI tells you the El Niño isn't uniquely large for its type. What makes its real-world impact potentially unprecedented is the baseline it's landing on, roughly 1.3°C above pre-industrial.[9] Daniel Swain, the prominent climate scientist and climatologist, framed it this way: we've never run a strong or very strong El Niño on a background this warm.[10] 2024 was already the first calendar year above 1.5°C, with no strong El Niño on top. Add one now and the same ENSO mechanics operate in a hotter, more volatile system than the one that produced even 1997-98.
The human toll of past strong events is on the record, and it now lands on a warmer baseline:
- Food supply. The 2015-16 event left an estimated 60 million people food-insecure across eastern and southern Africa. The 1965-66 event drove India's "ship-to-mouth" food crisis, and 1972-73's collapse of Peru's anchoveta fishery, from around 12 million to 2 million tonnes, fed a global food price shock.
- Flooding and displacement. The 1997-98 event's East African floods displaced millions, while its Indonesian fires and haze affected tens of millions more. The 1982-83 event brought severe flooding to Peru and Ecuador and around US$13 billion in damage worldwide.
- Drought, fire and the Amazon. Southeast Asian peatland fires in 1997-98 released on the order of a gigatonne of CO₂. Eastern Australia's worst droughts and bushfire seasons cluster on El Niño years, and the 2023-24 event took the Rio Negro at Manaus to its lowest level on record.
- Coral. The three most recent global mass bleaching events each coincided with strong El Niños: 1997-98, 2015-16 and 2023-24.
Most CMIP6 models project ENSO's rainfall swings will widen further as warming continues.[11] The same event lands harder now than it would have in the 1980s. None of it is guaranteed, and which regions are hit depends on where the teleconnections settle.
The two forecasts, and why they agree
Two independent methods point the same way, which is most of the reason to take the forecast seriously. The NOAA/IRI plume is physics-based, averaging many dynamical and statistical models. Alongside it, Seoul National University's deep-learning model, a convolutional neural network built on the Ham et al. 2019 method, learns from past ocean patterns and forecasts up to 18 to 24 months ahead.[6][7]
The sequence is the interesting part. The AI settled on a roughly +2.6 to +2.7°C RONI peak back in April, months before the plume did. The plume then climbed, issuance by issuance, and has now edged past it. As of July the plume sits at +2.7°C and the AI has eased down to +2.4°C. NOAA's own odds followed the same path, from 25% in April to 81% by July for a very strong event in October to December.[12]
Two things follow from that. When a physics model and a machine-learned one converge on a very strong event from opposite directions, that's a real signal, and the spread of roughly +2.4 to +2.7°C RONI is the honest uncertainty around the peak. And the AI trimming its own forecast as real observations came in is a point in its favour. It's updating, not stuck on a scary number.
Step 4 ... The next year, and what usually comes after
The El Niño's effects will ramp up as it peaks, October to December 2026, and mostly land over the following winter and into spring 2027. The record year question sits here too ... the lag usually puts the global temperature record in the year after the peak, which is why 2016 and 2024 held the records, not 2015 or 2023. So 2027 is the stronger candidate, though a fast-developing event keeps 2026 in play.[10] Roughly what to expect, and when:
- Maritime SE Asia and eastern Australia: warmer and drier through to February, raising drought and fire risk.
- East Africa (Horn): wetter "short rains" October to December 2026, with flood risk.
- Southern Africa: warmer and drier across the maize belt, December to February.
- Peru and Ecuador (coast): warmer and wetter January to March 2027, coastal flooding risk.
- Atlantic basin: conditions that tend to suppress the 2026 hurricane season.
Then the part almost no one is covering. A strong El Niño is usually only the first half of the cycle. Big events have repeatedly been followed by La Niña, sometimes multi-year: 1972-73 gave way to the deep 1973-76 La Niña, and 1997-98 to the 1998-2001 event. The physics-based plume doesn't show one yet, but its window only runs to about spring 2027.[5] The SNU model reaches further out, and it now has the El Niño peaking and then flipping to a La Niña during 2027. At least one independent analog forecast agrees, with El Niño in 2026 giving way to La Niña through 2027 into 2028.[13]
If that holds, the second year would bring close to the opposite pattern: wetter conditions returning to Australia, Indonesia and southern Africa, drier weather across the Horn of Africa and the southern US, and a more active Atlantic hurricane season. That flip redistributes the human risk rather than lifting it. The last La Niña, the 2020-23 triple-dip, drove the Horn of Africa's worst drought in 40 years and left around 20 million people food-insecure, while La Niña-charged rainfall fed the 2022 Pakistan floods that displaced some 33 million. Long-lead ENSO forecasts carry low verified skill, so treat the flip as the likely next chapter rather than a fixed date. But a strong El Niño followed by a strong La Niña is two years of disruption, not one, and planning a season at a time misses the second half.
What's genuinely uncertain
No forecast model has been verified at these peak magnitudes, or at the long lead where the La Niña appears, because there's no precedent for either. The odds of a very strong El Niño are high and independently supported. The exact peak, and the timing of what follows, are not.
Read this way, the story is calmer and longer than the headlines. A very strong El Niño is likely by winter. Its own strength is close to, not far beyond, the strongest events on record. What makes it matter is the warming it's landing on, its effects run at least into 2027, and a La Niña plausibly follows after that. The tracker follows all of it, week by week, against the NOAA and IRI data.
References
- Climate Change News / World Weather Attribution (2026). Scientists warn El Niño could intensify climate extremes in 2026.
- Stockdale, T. (2026). Measuring the strength of El Niño. ECMWF Science Blog.
- NOAA Climate Prediction Center. Weekly Niño-region SST anomalies. NOAA CPC.
- NOAA Climate Prediction Center. Relative Oceanic Niño Index (RONI). NOAA CPC.
- IRI / CPC (2026). ENSO forecast, July 2026 quick look and multi-model plume. International Research Institute for Climate and Society.
- Seoul National University ACE Lab (2026). Deep-learning ENSO forecast (CNN). SNU.
- Ham, Y.-G., Kim, J.-H. & Luo, J.-J. (2019). Deep learning for multi-year ENSO forecasts. Nature 573, 568-572.
- NOAA Climate Prediction Center. Oceanic Niño Index (ONI v5), historical values. NOAA CPC.
- IPCC (2021). Climate Change 2021: The Physical Science Basis. AR6 WGI, Chapter 4 & Box TS.13.
- BBC Science Focus (2026). The most powerful climate phenomenon on record could hit in 2026 (comments by D. Swain, UCANR).
- Cai, W. et al. (2021). Changing El Niño-Southern Oscillation in a warming climate. Nature Climate Change 11, 27-34.
- NOAA Climate Prediction Center. ENSO strength probability outlook (RONI-based). NOAA CPC.
- Climate Impact Company (2026). Big El Niño in 2026 possible, followed by returning La Niña in 2027.